Edit chart
Loading graph
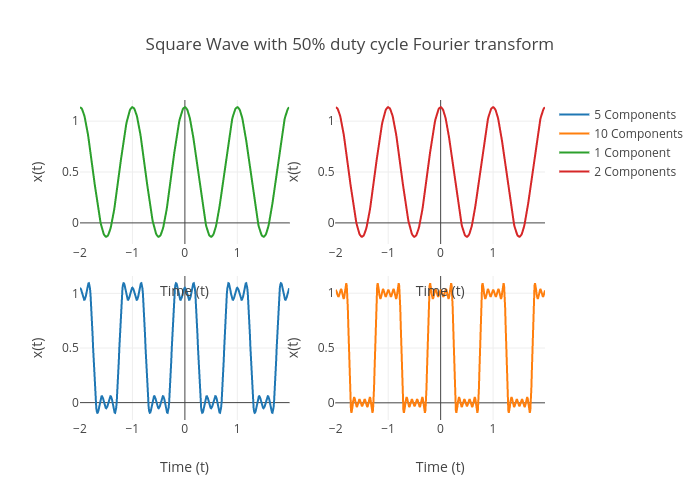
Satsugaisha's interactive graph and data of "Square Wave with 50% duty cycle Fourier transform" is a scatter chart, showing 5 Components, 10 Components, 1 Component, 2 Components; with Time (t) in the x-axis and x(t) in the y-axis.. The x-axis shows values from -2 to 1.9900000000000038. The y-axis shows values from -0.15924545178136468 to 1.1592454517813655.