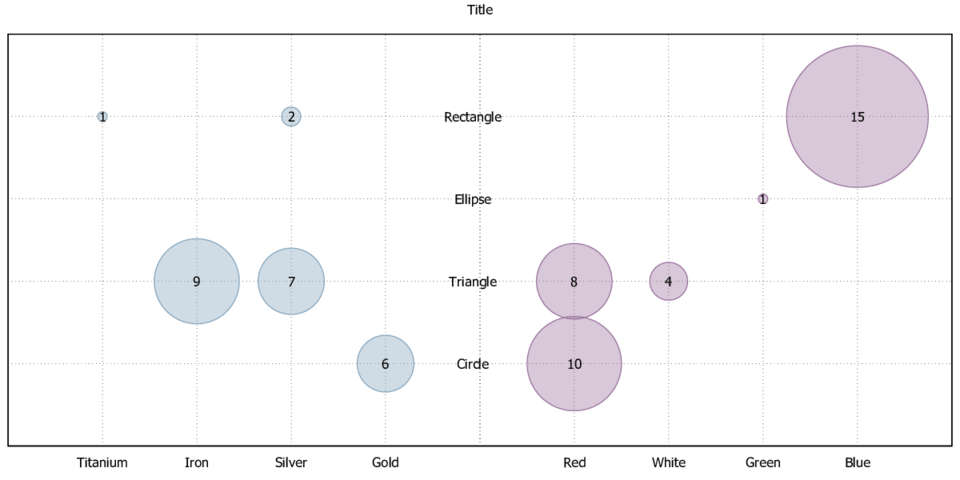
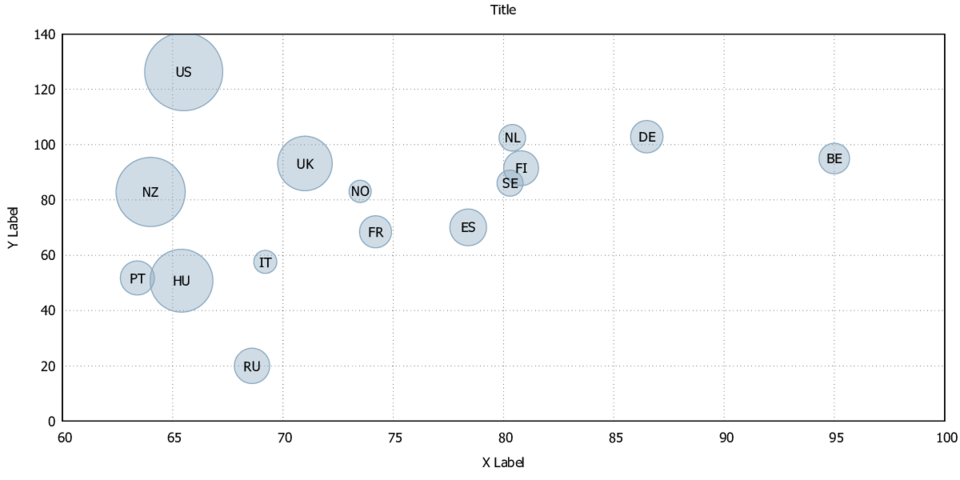
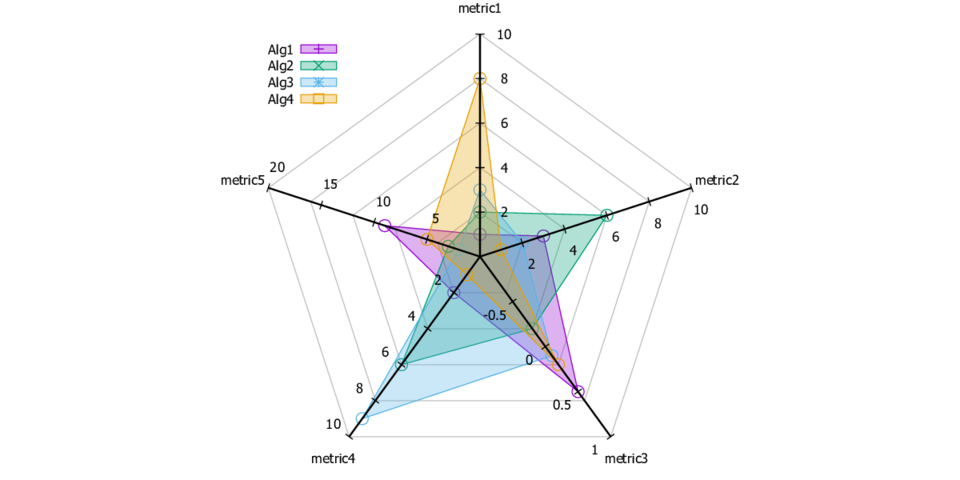
A comprehensive collection of Gnuplot examples
Firstly, install Gnuplot on your machine. Secondly, by using Console, run the gnuplot script with the following command:
gnuplot script.gnuClick in the figures to go directly to the gnuplot script.
Feel free to create issues here as you need
Contributions to the this project are very welcome! We can't do this alone! Feel free to fork this project, work on it and then make a pull request.
- Thiago Ferreira - Initial work
See also the list of contributors who participated in this project.
This project is licensed under the MIT License - see the LICENSE file for details


