


What is a fishbone diagram—and what can it do for you?

Any bump in the design process can be a learning opportunity. Maybe an unexpected setback is delaying product development, or you're worried your next release may not get rave customer reviews. Whatever issue you’re facing, the fishbone diagram is a simple and effective brainstorming tool that can help you solve problems—and keep them from cropping up in the first place.
Read on to learn more about:
- What a fishbone diagram is
- How a fishbone diagram can help you solve problems
- 5 steps to create a fishbone diagram—and FigJam tools that make it easy
Create your fishbone diagram with FigJam
Get started with FigJam's free fishbone diagram template today.
What’s a fishbone diagram?
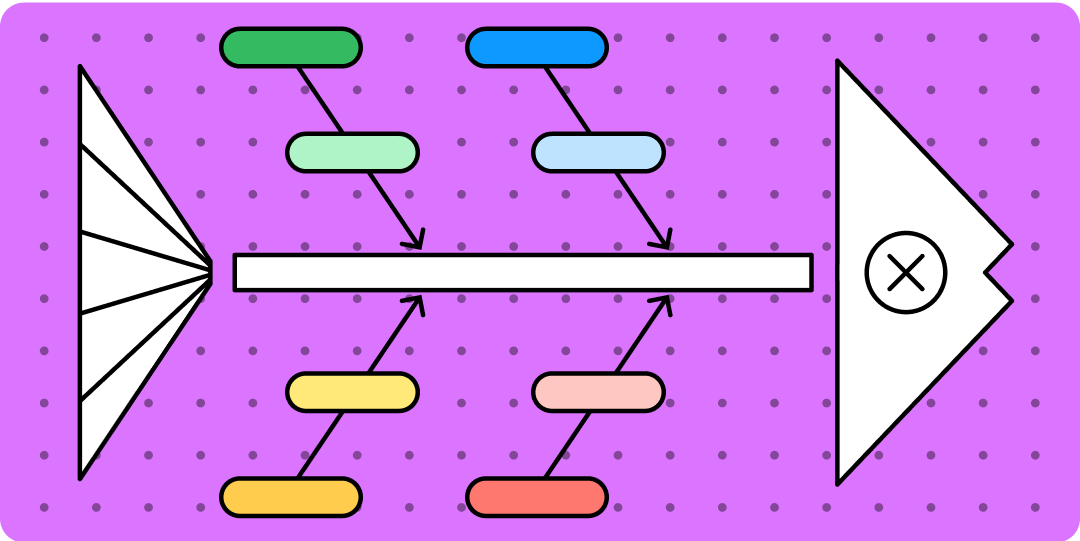
A fishbone diagram is also known as the cause-and-effect diagram, because it highlights the causes of a current or potential problem, or any other deviation from your team’s standard workflow. Companies use fishbone diagrams to help streamline processes, boost customer satisfaction, and drive better business outcomes.
The diagram actually looks like a fish skeleton. A horizontal arrow represents the fish spine and points to the problem (or effect), which is the head of the fish. Shorter arrows act as the fish ribs, branching out to expose the problem’s causes.
How the fishbone method solves problems
The fishbone method of analysis helps teams go deep with their problem-solving, uncovering key factors teams can target and troubleshoot. When used effectively, a fishbone diagram can help you1:
- Easily identify and categorize the causes—big and small—of a particular problem in a highly visual way.
- Develop actionable solutions more quickly by providing a structured yet flexible approach to address problems.
- Promote a more effective work environment by fostering better collaboration and communication across teams.
- Continuously improve your product or process by documenting root causes to avoid repeating the same mistakes in the future.
5 steps to create a fishbone diagram
Build your own fishbone diagram in five steps2:
Step 1: Define the problem.
Create a clear, concise problem statement. This should address a known issue or one you’re trying to prevent, such as “customer satisfaction rate for our app has fallen 20%.” Use FigJam’s online whiteboard to brainstorm and agree on a problem statement. Or try FigJam’s fishbone diagram template.
Step 2: Label potential issues.
You can use the six labels in the classic fishbone diagram (see sidebar), or create your own set of categories to suit the product and problem facing your team. For example, Mazda chose styling, touch, cornering, driving, listening, and braking as key issues to address in developing the MX5 Miata sports car.
Step 3: Brainstorm all possible causes.
Ask why this problem occurred, and organize possible causes by category. For example, under the people category, you might list causes for a drop in customer satisfaction as staff burnout, lack of training, or employee turnover. Some causes may fit under more than one category.
Step 4: Add more detail to your fishbone analysis.
Keep asking why to further identify sub-causes that contribute to the problem. FigJam’s 5 whys template will help you dig deeper.
Step 5: Review each cause and develop action items.
Work with your team to create a list of action items that will help solve the problem. Invite your team to check the finished diagram, making sure no detail has been overlooked (see sidebar).
Creative examples of fishbone diagrams
Popularized in Japan’s manufacturing industry in the 1960s, the fishbone or Ishikawa diagram is now industry-standard in multiple fields. From healthcare and higher education to retail and high tech, fishbone diagrams help teams improve and innovate.
For inspiration, consider these creative examples from a range of industries:
- Product defects fishbone diagram, Journal of Minerals and Materials Characterization and Engineering
- Carver County Public Health fishbone diagram, Minnesota Department of Health
- Cause and effect of blurry photos, Michigan State University Extension
- Bad coffee fishbone diagram, Kaizen Consulting Group
The classic 6-rib fishbone diagram
A typical fishbone diagram includes six ribs, each labeled with a potential issue to address. This could include:
- People. Evaluate everyone involved in the process, including their skill level, training, and performance.
- Machines. Examine equipment and any maintenance or upgrades required to solve a problem.
- Materials. Assess the raw and finished materials used. Do they meet expectations?
- Environment. Consider external factors such as bad weather or safety issues that can affect the development cycle.
- Method. Audit your team’s process—the number of steps, their complexity, and any potential bottlenecks.
- Measurement. Review the way your process is measured, controlled, and monitored.
Fishbone analysis pitfalls to avoid
The simplicity of a fishbone diagram makes it easy to use and understand, but it can also make it harder to prioritize tasks. Of all the causes identified in a fishbone diagram, a problem’s main causes aren’t necessarily ranked ahead of minor ones. It’s up to you and your team to prioritize issues that will have the most impact versus those that won’t.
Fishbone diagrams can sometimes reflect human biases, so you'll need to work to maintain objectivity. Gather input from key players across your company to ensure your fishbone analysis is valid and complete.
Bone up on your fishbone diagrams with FigJam
Problem-solving is a team sport. Work together to zero in on root causes using FigJam’s online collaborative whiteboard, then organize them with FigJam’s ready-made fishbone diagram template. If you’d rather make one from scratch, use FigJam’s free diagramming tools to:
- Produce an easy-to-understand visual that clearly shows cause-and-effect relationships.
- Collaborate in real time with key stakeholders to make sure the causes included are accurate and actionable.
- Construct a polished diagram that supports your brand and is presentation-ready.
Want to see an example of a fishbone diagram created in FigJam? Check out these inspiring fishbone diagrams shared by the Figma community.
Now you’ve got what you need to solve problems—and prevent them, too.
Sources
[1] https://6sigma.com/benefits-of-using-the-fishbone-diagram/
[2] https://www.ahrq.gov/sites/default/files/wysiwyg/ncepcr/resources/job-aid-5-whys.pdf
Keep reading

How to create a swimlane diagram
Swimlane diagrams give flowcharts an extra-informative superpower.
Learn more

How to create a flow chart
Having a flow chart can help visually represent actions or people in a complex situation.
Learn more

What is a UML diagram
UML diagrams can help you plan complex systems and processes.
Learn more