
FigJam
Plot out your relationships with our social network diagram

Whether it’s restructuring a multi-department organization or understanding the personal connections that matter, FigJam templates help you illuminate your most important social relationships.

diagram with lines that connect to colorful nodesdiagram with lines that connect to colorful nodes

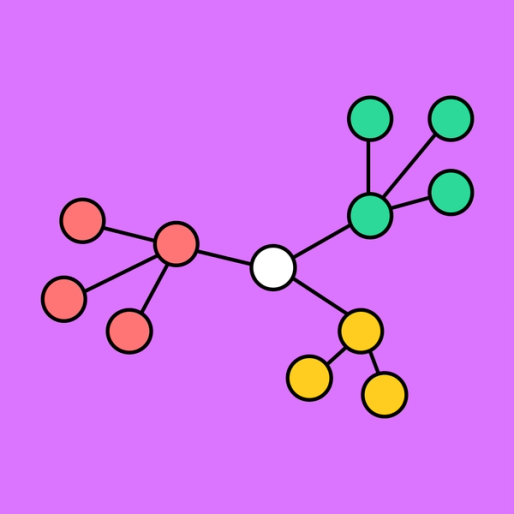
Social network diagram

Clue in or seek input from the entire group with our free interactive social network template.

Leave a paper trail for your team

Follow the flow of information to novel ideas and tip-top communication when you map out your social relationships one by one.

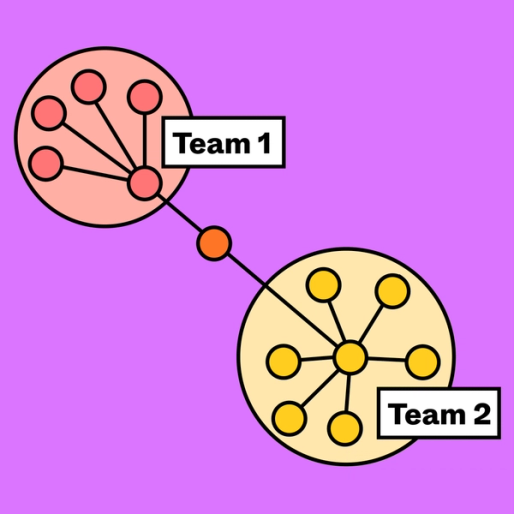
Make more connections: Encourage new interactions and stronger relationships when you understand the existing bonds between individuals in your community.

Share the details: Keep the group on the same page when you track the flow of information between connected points.

Prepare for discovery: Turn your data into innovative insights and promising action steps by improving communication between network members.

diagram with lines that connect to nodes labeled team 1 and team 2diagram with lines that connect to nodes labeled team 1 and team 2
diagram with lines that connect to multiple peoplediagram with lines that connect to multiple people

FigJam
Share the magnifying glass

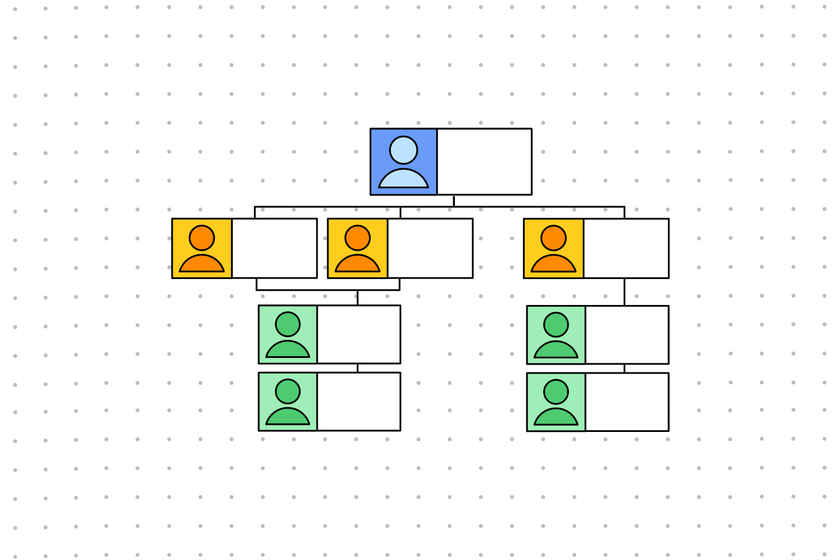
Sift through the facts with the entire group and discover insights. Arrange your relationships with our Org Chart, create digital portraits with our Avatars, and encourage new interactions in shared workspaces. Start with a hunch and clarify the answer together using FigJam templates.

FAQs

Social network analysis is an investigation of the relationships within an environment. They create an easy-to-understand visual representation of a social structure based on the principles of graph theory. Social networking diagrams can be used for a number of situations, including:

- Relationships within a residential neighborhood

- Data sharing among various computer networks in an organization

- Connections between sales, operations, and marketing departments in a company

The goal of a social network analysis example is to more fully and accurately understand the relationship dynamics of a community or environment. Visual elements such as nodes and arrows emphasize the connections that exist within or between groups. Understanding the nature of every interactionleads to smoother communication, information sharing, and delegation within complex networks.

Start with a social network map template and add nodes in different colors representing your key groups. For example, if you were to depict the relationships in your life, your nodes might be: family, friends, colleagues, and neighbors. Then, add more nodes to your social network diagram template connected to one of these key groups. These illustrate the relationships within each group. Lastly, a social network graph example often features connections between the various groups. Draw connecting arrows to show the overlap between your key nodes—for example, if a colleague is also a neighborhood friend.

Ready to get started? Our customizable templates help you sketch out a social network map template that’s uniquely you.

Other templates you might like

Explore 1,000+ templates on the Figma community

Explore even more templates, widgets, and plugins—all built by the Figma community.

Figma communityFigma community