 Zi-Piao Ye1†
 Yu Ling2†Qiang Yu3,4,5
 Hong-Lang Duan6Hua-Jing Kang7Guo-Min Huang6
 Shi-Hua Duan8Xian-Mao Chen9
 Yu-Guo Liu10*
 Shuang-Xi Zhou11*
- 1Maths & Physics College, Jinggangshan University, Ji’an, China
- 2College of Agricultural Sciences, Guangdong Ocean University, Zhanjiang, China
- 3State Key Laboratory of Soil Erosion and Dryland Farming on the Loess Plateau, Northwest A&F University, Yangling, China
- 4School of Life Sciences, University of Technology Sydney, Ultimo, NSW, Australia
- 5College of Resources and Environment, University of Chinese Academy of Science, Beijing, China
- 6Jiangxi Provincial Key Laboratory for Restoration of Degraded Ecosystems and Watershed Ecohydrology, Nanchang Institute of Technology, Nanchang, China
- 7Department of Landscape Architecture, Wenzhou Vocational College of Science & Technology, Wenzhou, China
- 8School of Life Sciences, Jinggangshan University, Ji’an, China
- 9Soil Fertilizer and Environmental Resources Institute, Jiangxi Academy of Agricultural Sciences, Nanchang, China
- 10Institute of Desertification Studies, Chinese Academy of Forestry, Beijing, China
- 11The New Zealand Institute for Plant and Food Research Limited, Havelock North, New Zealand
Light intensity (I) is the most dynamic and significant environmental variable affecting photosynthesis (An), stomatal conductance (gs), transpiration (Tr), and water-use efficiency (WUE). Currently, studies characterizing leaf-scale WUE–I responses are rare and key questions have not been answered. In particular, (1) What shape does the response function take? (2) Are there maximum intrinsic (WUEi; WUEi–max) and instantaneous WUE (WUEinst; WUEinst–max) at the corresponding saturation irradiances (Ii–sat and Iinst–sat)? This study developed WUEi–I and WUEinst–I models sharing the same non-asymptotic function with previously published An–I and gs–I models. Observation-modeling intercomparison was conducted for field-grown plants of soybean (C3) and grain amaranth (C4) to assess the robustness of our models versus the non-rectangular hyperbola models (NH models). Both types of models can reproduce WUE–I curves well over light-limited range. However, at light-saturated range, NH models overestimated WUEi–max and WUEinst–max and cannot return Ii–sat and Iinst–sat due to its asymptotic function. Moreover, NH models cannot describe the down-regulation of WUE induced by high light, on which our models described well. The results showed that WUEi and WUEinst increased rapidly within low range of I, driven by uncoupled photosynthesis and stomatal responsiveness. Initial response rapidity of WUEi was higher than WUEinst because the greatest increase of An and Tr occurred at low gs. C4 species showed higher WUEi–max and WUEinst–max than C3 species—at similar Ii–sat and Iinst–sat. Our intercomparison highlighted larger discrepancy between WUEi–I and WUEinst–I responses in C3 than C4 species, quantitatively characterizing an important advantage of C4 photosynthetic pathway—higher An gain but lower Tr cost per unit of gs change. Our models can accurately return the wealth of key quantities defining species-specific WUE–I responses—besides An–I and gs–I responses. The key advantage is its robustness in characterizing these entangled responses over a wide I range from light-limited to light-inhibitory light intensities, through adopting the same analytical framework and the explicit and consistent definitions on these responses. Our models are of significance for physiologists and modelers—and also for breeders screening for genotypes concurrently achieving maximized photosynthesis and optimized WUE.
Introduction
Stomata control the balance between carbon flux driven by photosynthesis and water flux dominated by transpiration, which is characterized by water-use efficiency (WUE) at various scales (Sinclair et al., 1984; Gilbert et al., 2011; Eamus et al., 2016; Medlyn et al., 2017). WUE can thus indicate the natural selection on the balance between these fluxes (Hetherington and Woodward, 2003). Characterizing the environmental impacts on WUE among plant species and/or plant function types can advance our knowledge on differential plant adaptation strategies, and improve our prediction on consequences of environmental challenges (Avola et al., 2008; Egea et al., 2011; Zhou et al., 2014, 2016; De Kauwe et al., 2015; Köhler et al., 2016; Ahrar et al., 2017). For instance, plant species with the highest WUE would show the greatest fitness in dry habitats (Dudley, 1996; Zhou et al., 2019). WUE is also an important metric in crop breeding and genotype selection, especially for irrigated crops whose water use significantly affects crop productivity and profitability (Duursma et al., 2013; Flexas et al., 2013; Bota et al., 2016; Webster et al., 2016).
WUE can be estimated using different techniques, based on observations of leaf gas exchange, stable isotope discrimination, and eddy covariance fluxes (Medlyn et al., 2017). Among these techniques, WUE is most commonly estimated by measuring leaf gas exchange, facilitated by portable photosynthesis system allowing simultaneous measurement of leaf-scale carbon and water fluxes (Medrano et al., 2015). WUE derived from leaf gas exchange measurement is usually defined as the ratio of net CO2 assimilation rate (An) to stomatal conductance for water vapor (gs)—intrinsic water-use efficiency (WUEi; von Caemmerer and Farquhar, 1981), or the ratio of An to transpiration rate (Tr)—instantaneous water-use efficiency (WUEinst; Fischer and Turner, 1978) (see Table 1 for a summary of parameters and units). WUEi can be used to compare photosynthetic characteristics independently of evaporative demand (Linares and Camarero, 2012). WUEinst is a key determinant of whole-plant WUE as it summarizes plant dry mass production per unit of water loss (Sinclair et al., 1984; Duursma et al., 2013; but see Medrano et al., 2015 for constraints). WUEi and WUEinst have been widely used as an index of plant and vegetation performances in response to various environmental changes, such as changed water or light availabilities, vapor pressure deficit (VPD), temperature and CO2 concentration (Aranda et al., 2007; Avola et al., 2008; Linares and Camarero, 2012; Duursma et al., 2013; Bota et al., 2016).
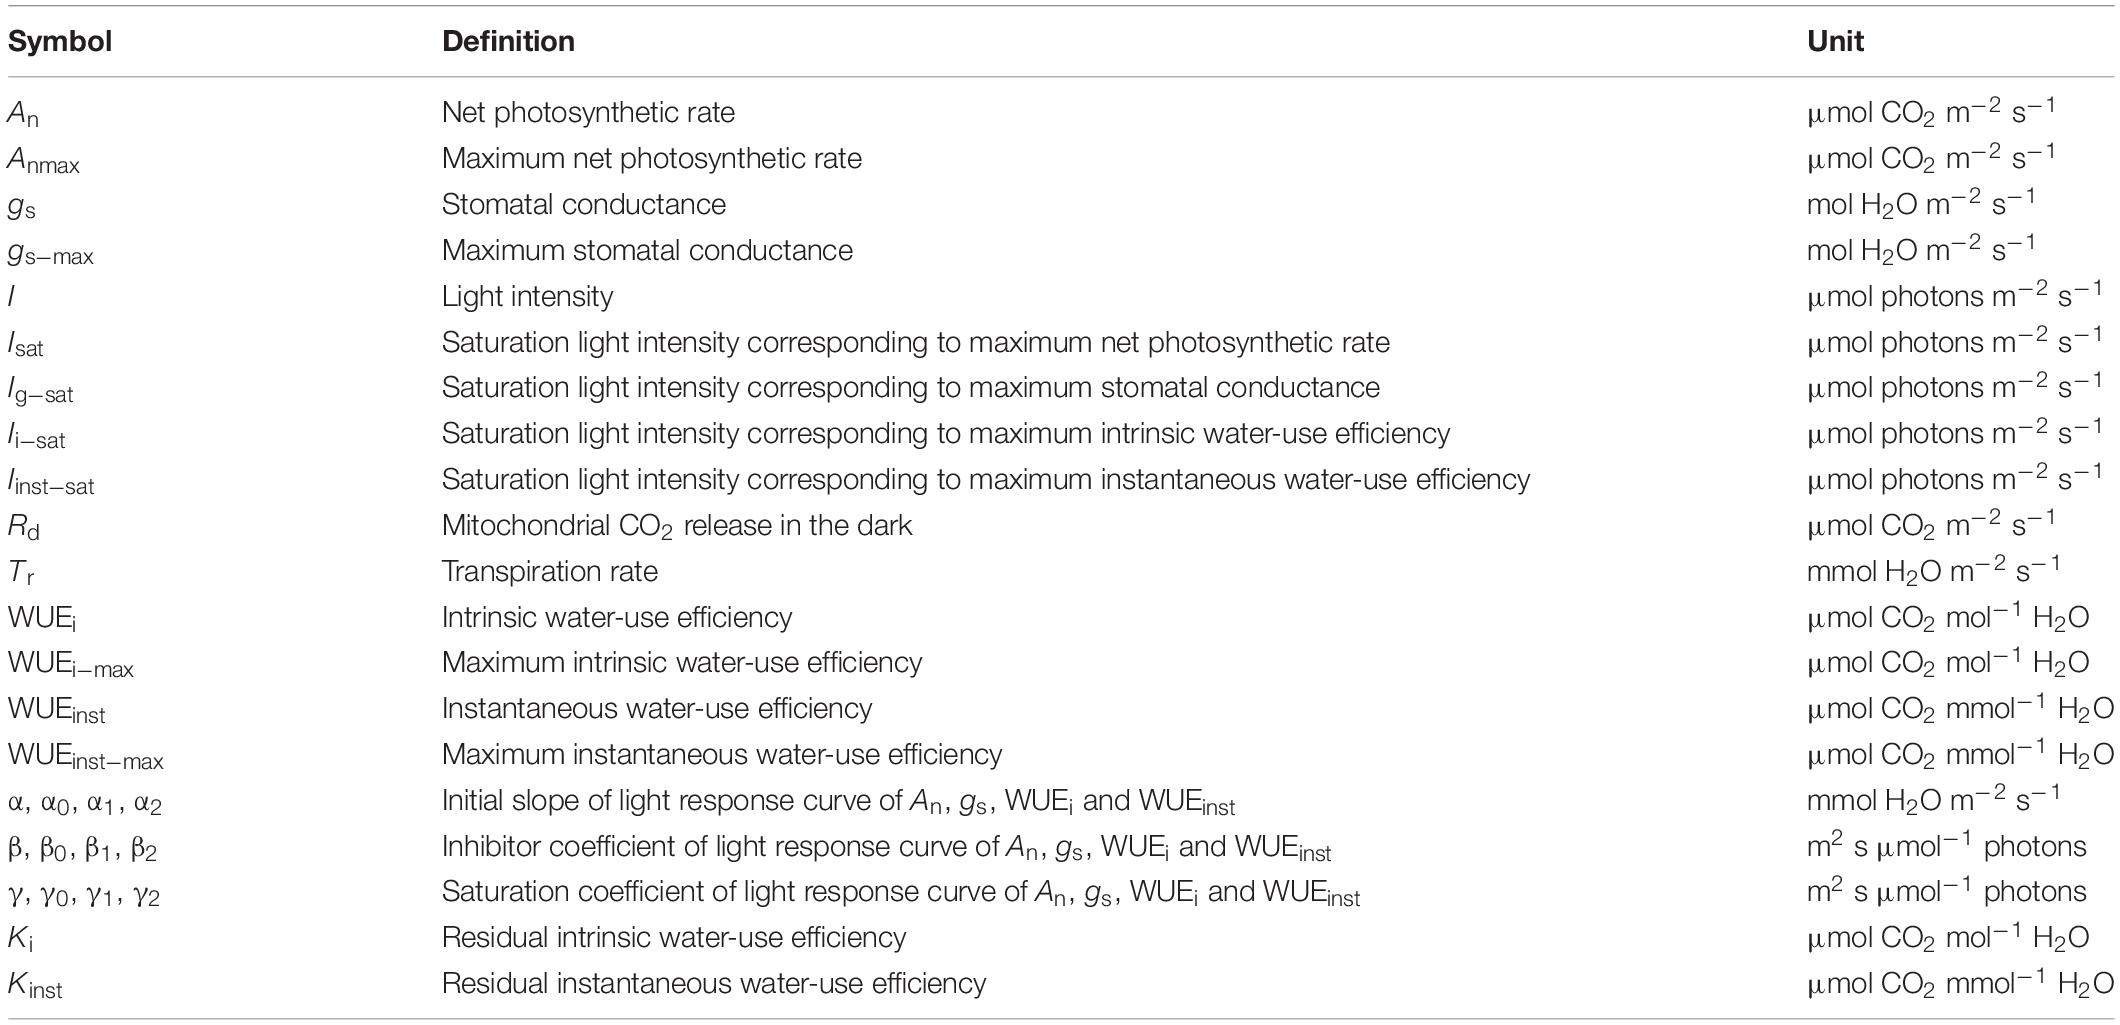
Table 1. List of major model parameters defining the light response curves of photosynthesis (An), stomatal conductance (gs), intrinsic water use efficiency (WUEi), and instantaneous water use efficiency (WUEinst).
Light is often viewed as the most significant environmental variable affecting photosynthesis, stomatal behavior and WUE (Knapp and Smith, 1987; Aranda et al., 2007; McAusland et al., 2016). Plants in most ecosystems experience rapid short-term variability in light resource (Smith et al., 1989), which can cause continual transition of An, gs, Tr, WUEi, and WUEinst throughout the growing season (Knapp and Smith, 1990; Knapp, 1993). However, studies characterizing the light response of WUE are rare (McAusland et al., 2016). It is largely unknown whether there is a maximum WUEi or WUEinst—and the corresponding saturation irradiance—for plants under dynamic irradiance conditions, or how plant species or plant function types (PFTs) would differ in their light responses of WUEi and WUEinst.
Characterization of the interrelationships among light responses of An, gs, Tr, WUEi and WUEinst—which can be simultaneously measured—will be fundamental to the scaling-up modeling of WUE–I responses at the whole-plant and ecosystem scale. The foremost step toward this direction calls for a robust model, with which (1) the WUEi and WUEinst responses to a gradient of irradiance intensity (I) levels (WUEi–I and WUEinst–I response curve, respectively) can be characterized, and (2) the key quantities defining the response curves—such as the initial slope of the response curve, the maximum WUE and the corresponding saturation irradiance—can be quantified. Ideally, the model can accurately represent the differential WUEi and WUEinst responses among plant species or PFTs, such as that reported between C3 and C4 species with contrasting light responses of photosynthesis, stomatal functioning, and WUE (Pearcy and Ehleringer, 1984; Knapp, 1993). For a given An, gs and Tr are higher in C3 than C4 plants, leading to higher WUEi and WUEinst in C4 plants, which has higher utilization efficiency of CO2 at relatively lower intercellular CO2 concentration (Pearcy and Ehleringer, 1984). The objectives of this study were to develop a leaf-scale WUE–I model and assess the model performance against experimental field observations of C3 and C4 species in order to answer key questions of how best to model the light response of WUEi and WUEinst. In particular: (1) What shape does the leaf-scale WUE–I response function take? Is there a maximum WUEi and/or WUEinst—and the corresponding saturation irradiances for plants under dynamic irradiance conditions? (2) Can the model well represent the differential WUEi–I and/or WUEinst–I response characteristics between C3 and C4 species? By integrating the published An–I (Ye, 2007; Ye et al., 2013) and gs–I (Ye and Yu, 2008) response function, we developed an explicit WUE–I modeling framework and hypothesized that the species-specific light response curves of WUEi and WUEinst can be quantitatively characterized using the same non-asymptotic function. The hypothesis was tested using an observation-modeling intercomparison on WUEi–I and WUEinst–I responses for field-grown C3 [soybean (Glycine max L.)] and C4 species [grain amaranth (Amaranthus hypochondriacus L.)] under high I condition in the growing season. Model performance against that of the non-rectangular hyperbola model was also evaluated.
Materials and Methods
Analytical Models
A non-asymptotic model has been previously developed and tested to well characterize the light response of photosynthesis (Ye, 2007; Ye et al., 2013), with its simplified form as follows:
where α is the initial slope of light response curve of photosynthesis, I is the irradiance, and β and γ are the photoinhibition coefficient and saturation coefficient, respectively, and Rd is the dark respiratory rate. The key model parameters are listed in Table 1.
The saturation irradiance (Isat) corresponding to the light-saturated photosynthetic rate (Anmax) can be calculated as follows:
Eq. 1 has been widely used to characterize photosynthetic light response curves of various plant species under different environmental conditions, highlighting its better performance than that of rectangular (Baly, 1935) and non-rectangular hyperbolic models (Thornley, 1976; Wargent et al., 2011; Xu et al., 2012a, b; Song et al., 2015; Chen et al., 2016). The rectangular and the non-rectangular hyperbolic models have been reported to overestimate Anmax (dos Santos et al., 2013), and cannot quantify Isat (Gomes et al., 2006; dos Santos et al., 2013; Song et al., 2015; Chen et al., 2016).
Meanwhile, a model of the same non-asymptotic form as Eq. 1 has been developed and tested to well characterize the light response of stomatal conductance (Ye and Yu, 2008), as follows:
where α0 is the initial slope of light response curve of stomatal conductance, gs0 is the residual stomatal conductance, and β0 and γ0 are two coefficients that are independent of I (Ye and Yu, 2008). Most existing stomatal conductance models cannot quantify the gs–max or the corresponding Ig–sat under changing irradiance conditions (Dewar, 2002; Buckley et al., 2003; Buckley and Mott, 2013; Flexas et al., 2013). The gs–I model developed by Ye and Yu (2008) can well characterize the gs–I response, from which key parameters defining the gs–I response—such as gs–max and Ig–sat—can be easily obtained.
The saturation irradiance (Ig–sat) corresponding to the light-saturated stomatal conductance (gs–max) can be calculated as follows:
Here, we hypothesize that the light response of WUEi can be characterized using the same non-asymptotic form as that of the An–I (Eq. 1) and gs–I (Eq. 4) response functions, as follows:
where α1 represents the initial slope of light response curve of WUEi, β1, and γ1 are coefficients that are independent of I, and Ki is the residual intrinsic water-use efficiency. The saturation irradiance (Ii–sat) corresponding to the maximum WUEi (WUEi–max) can be calculated as follows:
Since gs controls leaf Tr at a given VPD (Duursma et al., 2013), we hypothesize that the light response of WUEinst can also be characterized using the same non-asymptotic function as that of WUEi–I response function (Eq. 7), as follows:
where α2 represents the initial slope of light response curve of WUEinst, β2 and γ2 are coefficients that are independent of I, and Kinst is the residual instantaneous water-use efficiency. The saturation irradiance (Iinst–sat) corresponding to the maximum WUEinst (WUEinst–max) can be calculated as follows:
In this study, we tested if Eqs. 7 and 10 can well characterize the species-specific WUE–I response characteristics against model-oriented field observations and the simulations using the non-rectangular hyperbola model—in terms of the initial slope of light response curve of WUE (α1 and α2, respectively), the maximum WUEinst (WUEi and WUEinst–max, respectively), and the saturation irradiance (Ii–sat and Iinst–sat, respectively).
Study Site and Plant Material
The field observations on one C3 species—soybean (Glycine max L.) and one C4 species—grain amaranth (A. hypochondriacus L.) were conducted at the Yucheng Comprehensive Experiment Station of the Chinese Academy of Sciences, located at the irrigation district of the Yellow River Basin in the North China Plain. This region is dominated by the warm-temperate semi-humid monsoon climate and is suitable for planting soybean and grain amaranth with high yields. This region has ample energy resource, and the light intensity in the growing season usually reaches ∼2000 μmol m–2 s–1 in sunny days. Soybean and grain amaranth were planted in field on May 3rd and June 15th 2012, respectively. All plants were kept under moist condition throughout the experiment.
Light Response Curve Measurement
The leaf gas exchange measurements were conducted after 45 days of growth in field—June 16th for soybean and July 29th for grain amaranth. Fully expanded sun-exposed leaves of four plants for each species were measured using a portable photosynthesis system (LI-6400, Li-Cor Inc., Lincoln, NE, United States). Before each measurement, the leaf was acclimated in the chamber to achieve stable gas exchange, with reference CO2 concentration maintained at 380 μmol CO2 mol–1, irradiance intensity maintained at 2000 μmol photon m–2 s–1, and leaf temperature maintained at 35°C. After the leaf acclimated to the cuvette environment, the photosynthetic light response curve measurements were conducted with a descending gradient of irradiance intensity levels, as follows: 2000, 1800, 1600, 1400, 1200, 1000, 800, 600, 400, 200, 150, 100, 80, 50, and 0 μmol m–2 s–1. At each irradiance level, leaf gas exchange was monitored to ensure reaching steady-state plateau before data-logging. VPD was kept stable during measurements (Supplementary Figure S1). The An–I, gs–I, WUEi–I, and WUEinst–I response curves were fitted by Eqs. 1, 4, 7, and 10, respectively. Isat, Ig–sat, Ii–sat, and Iinst–sat values were calculated following Eqs. 2, 5, 8, and 11, respectively. Anmax, gs–max, WUEi–max, and WUEinst–max values were calculated following Eqs. 3, 6, 9, and 12, respectively.
Data Analysis
All statistical tests were performed using the statistical package SPSS 18.5 statistical software (SPSS, Chicago, IL, United States). The analysis of variance (ANOVA) was used to assess species effects. Paired-sample t tests were conducted to test whether there were significant differences between fitted and measured values of quantitative traits (α, Anmax, Isat, α0, gs–max, Ig–sat, α1, WUEi–max, Ii–sat, α2, WUEinst–max, Iinst–sat, etc.). Goodness of fit of the mathematical model to experimental observations was assessed using the coefficient of determination (r2 = 1–SSE/SST, where SST is the total sum of squares and SSE is the error sum of squares).
Results
Light Response Curves of An, gs, and Tr
The increase of I led to a rapid initial increase of An (Figures 1A,B), gs (Figures 1C,D), and Tr (Figures 1E,F) for both C3 and C4 species. However, the initial increase rate of An was 100-fold higher than that of gs for both species (Tables 2 and 3). The high coefficient of determination (r2) values indicated that the species-specific An–I response curves fitted by Eq. 1—and the gs–I response curves fitted by Eq. 4—were highly representative of the observations for both species (Figure 1).
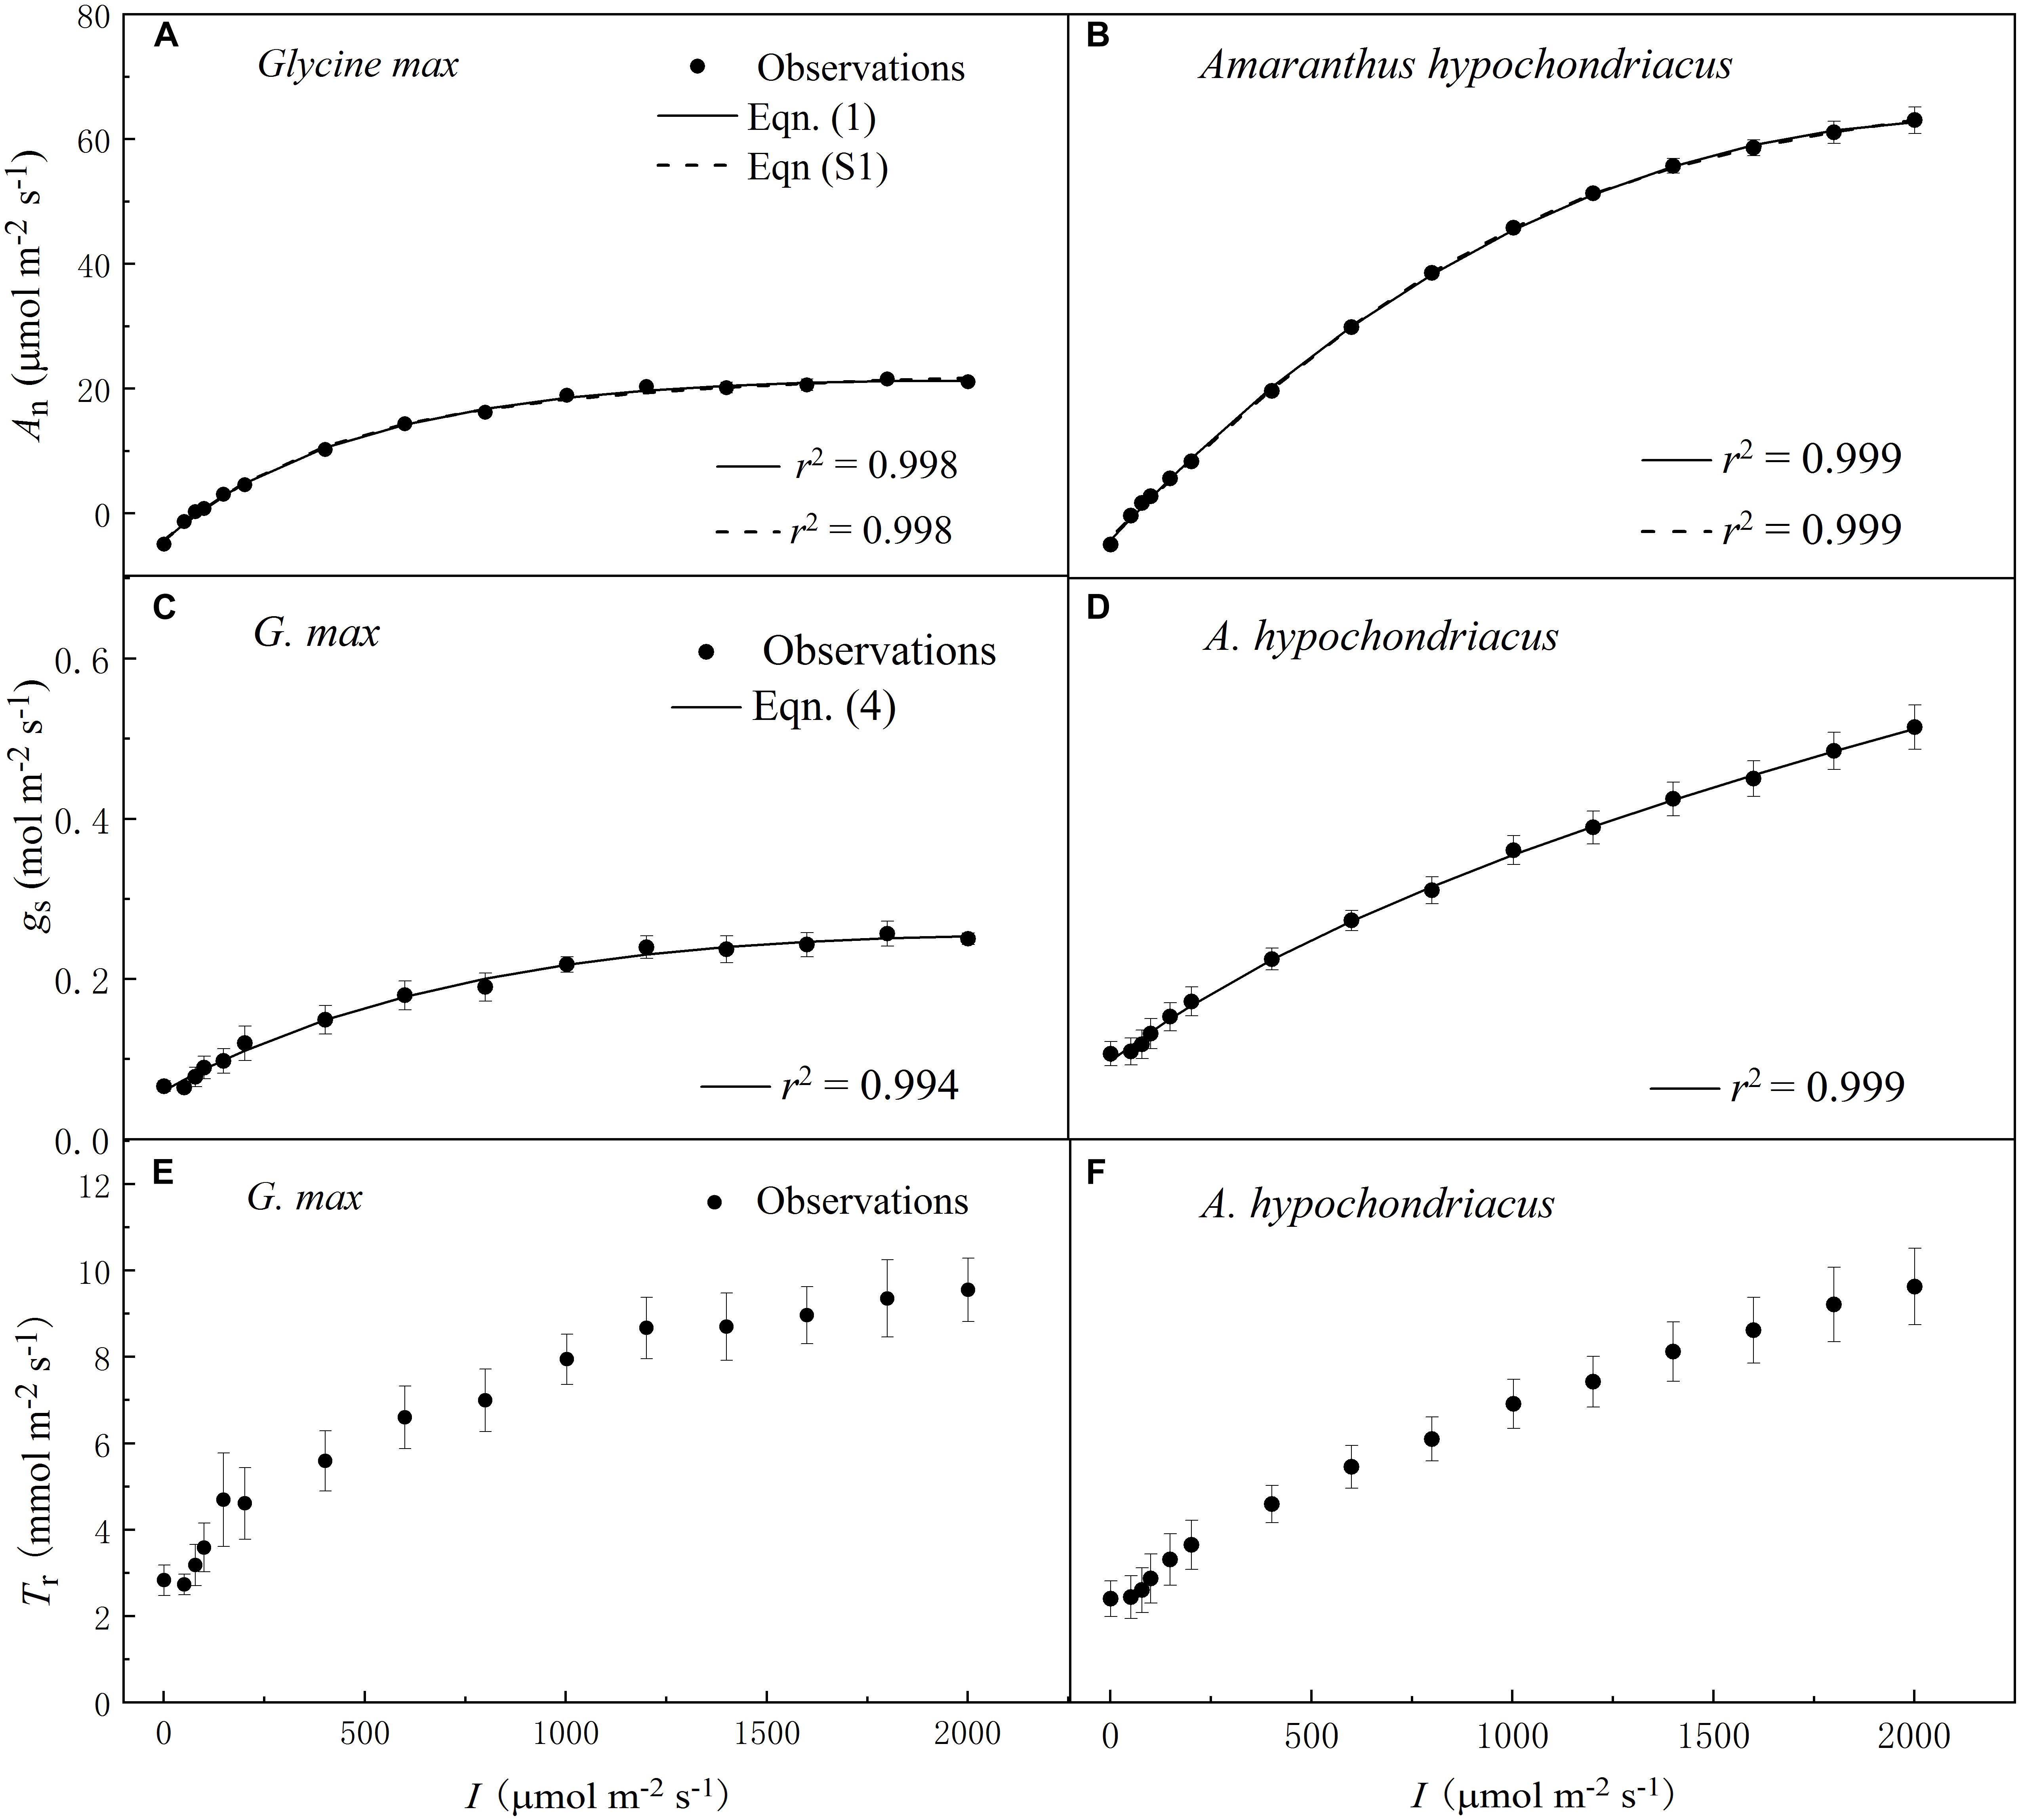
Figure 1. Irradiance (I) responses of net photosynthetic rate (An) (A,B), stomatal conductance (gs) (C,D) and transpiration rate (Tr) (E,F) for C3 [soybean (Glycine max)] and C4 species [grain amaranth (Amaranthus hypochondriacus)], respectively. In plots (A) and (B), solid lines were fitted using Eq. 1 and dashed lines were fitted using the non-rectangular hyperbola model (Eq. S1). In plots (C) and (D), solid lines were fitted using Eq. 4. Data are the mean ± SE (n = 4).
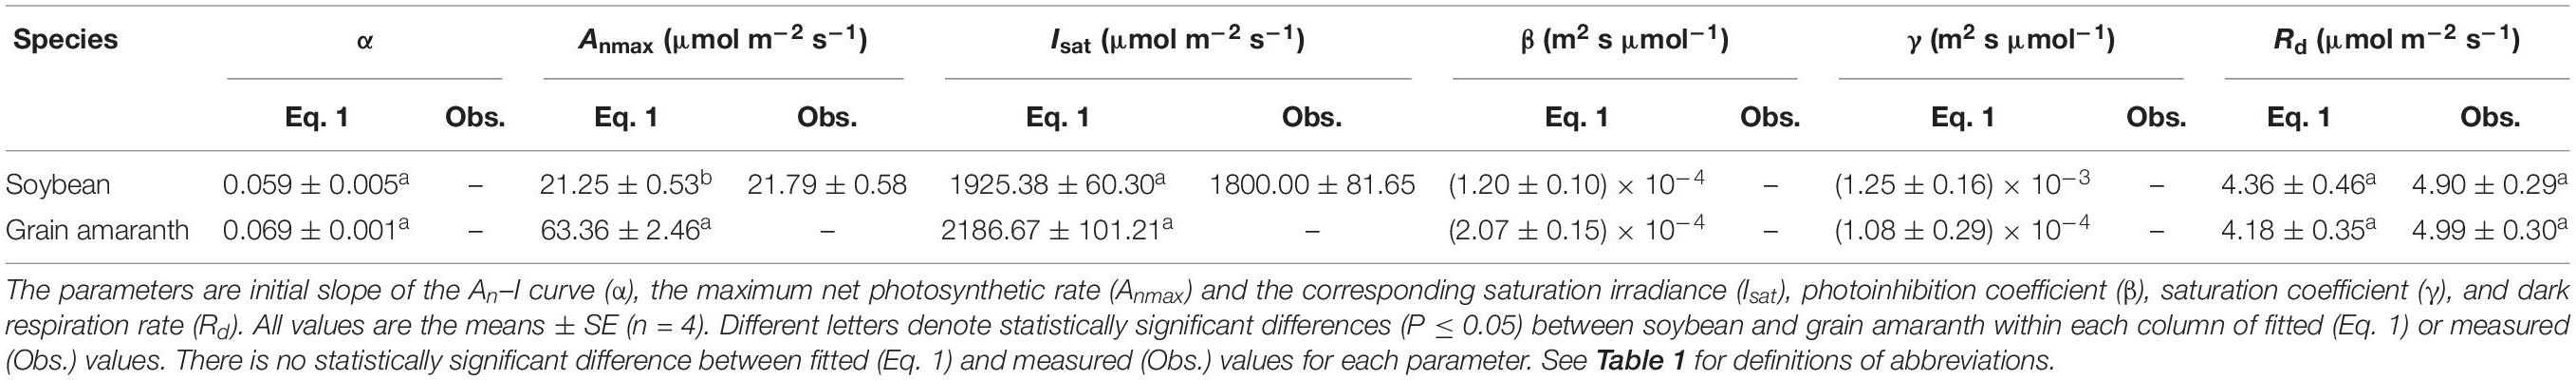
Table 2. Fitted (Eq. 1) and measured (Obs.) values of parameters defining the light response curve of photosynthesis for C3 (soybean) and C4 species (grain amaranth).
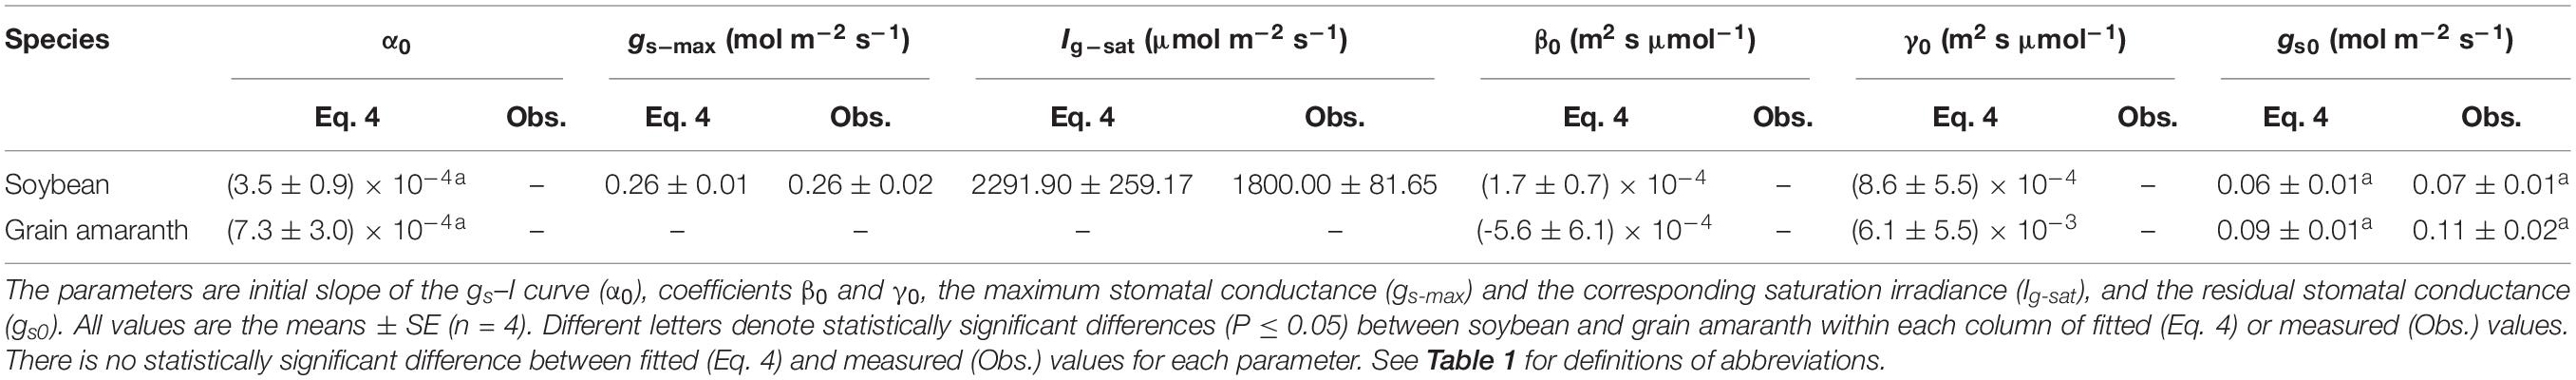
Table 3. Fitted (Eq. 4) and measured (Obs.) values of parameters defining the light response curve of stomatal conductance for C3 (soybean) and C4 species (grain amaranth).
Soybean exhibited a single-peaked pattern for both An–I and gs–I responses, characterized by the increase of An and gs with the increasing I until reaching the Anmax and gs–max at the corresponding Isat and Ig–sat, respectively (Figures 1A,C and Tables 2 and 3). Compared with Eq. 1, the non-rectangular hyperbola model (Supplementary Eq. S1) showed similarly high r2 value in simulating An–I response curves but significantly overestimated the Anmax (Figures 1A,B and Supplementary Table S1). Paired-sample t tests showed there were no significant differences between the fitted values and the measured values of Anmax, Isat, gs–max, and Ig–sat for soybean (Tables 2 and 3). Grain amaranth kept increasing its An and gs within the range of irradiance intensity applied during measurements (0–2000 μmol photon m–2 s–1), without showing an observational Anmax, Isat, gs–max, or Ig–sat (Figures 1B,D and Tables 2 and 3). Grain amaranth showed relatively higher (not significant) initial increase rate of gs, characterized by an initial slope of the light response curve of gs (α0) (Figure 1 and Tables 2 and 3).
Light Response Curves of WUEi and WUEinst
Within the low range of irradiance intensity, WUEi and WUEinst of both species increased almost linearly with the increasing I. Both soybean and grain amaranth exhibited a single-peaked WUEi–I and WUEinst–I response pattern, respectively. In particular, both species showed an increase of WUEi and WUEinst with the increasing I until reaching the species-specific WUEi–max and WUEinst–max at the corresponding species-specific saturation irradiance levels (Ii–sat and Iinst–sat, respectively) (Figure 2 and Tables 4 and 5). However, soybean showed significantly lower observed and fitted WUEi–max and WUEinst–max (P ≤ 0.05) than grain amaranth (Figure 2 and Tables 4 and 5). The two species showed no significant difference in Ii–sat, Iinst–sat or the initial increase rate of WUEi or WUEinst—characterized by a maximal slope of the light response curves (α1 and α2, respectively) (Figure 2 and Tables 4 and 5).
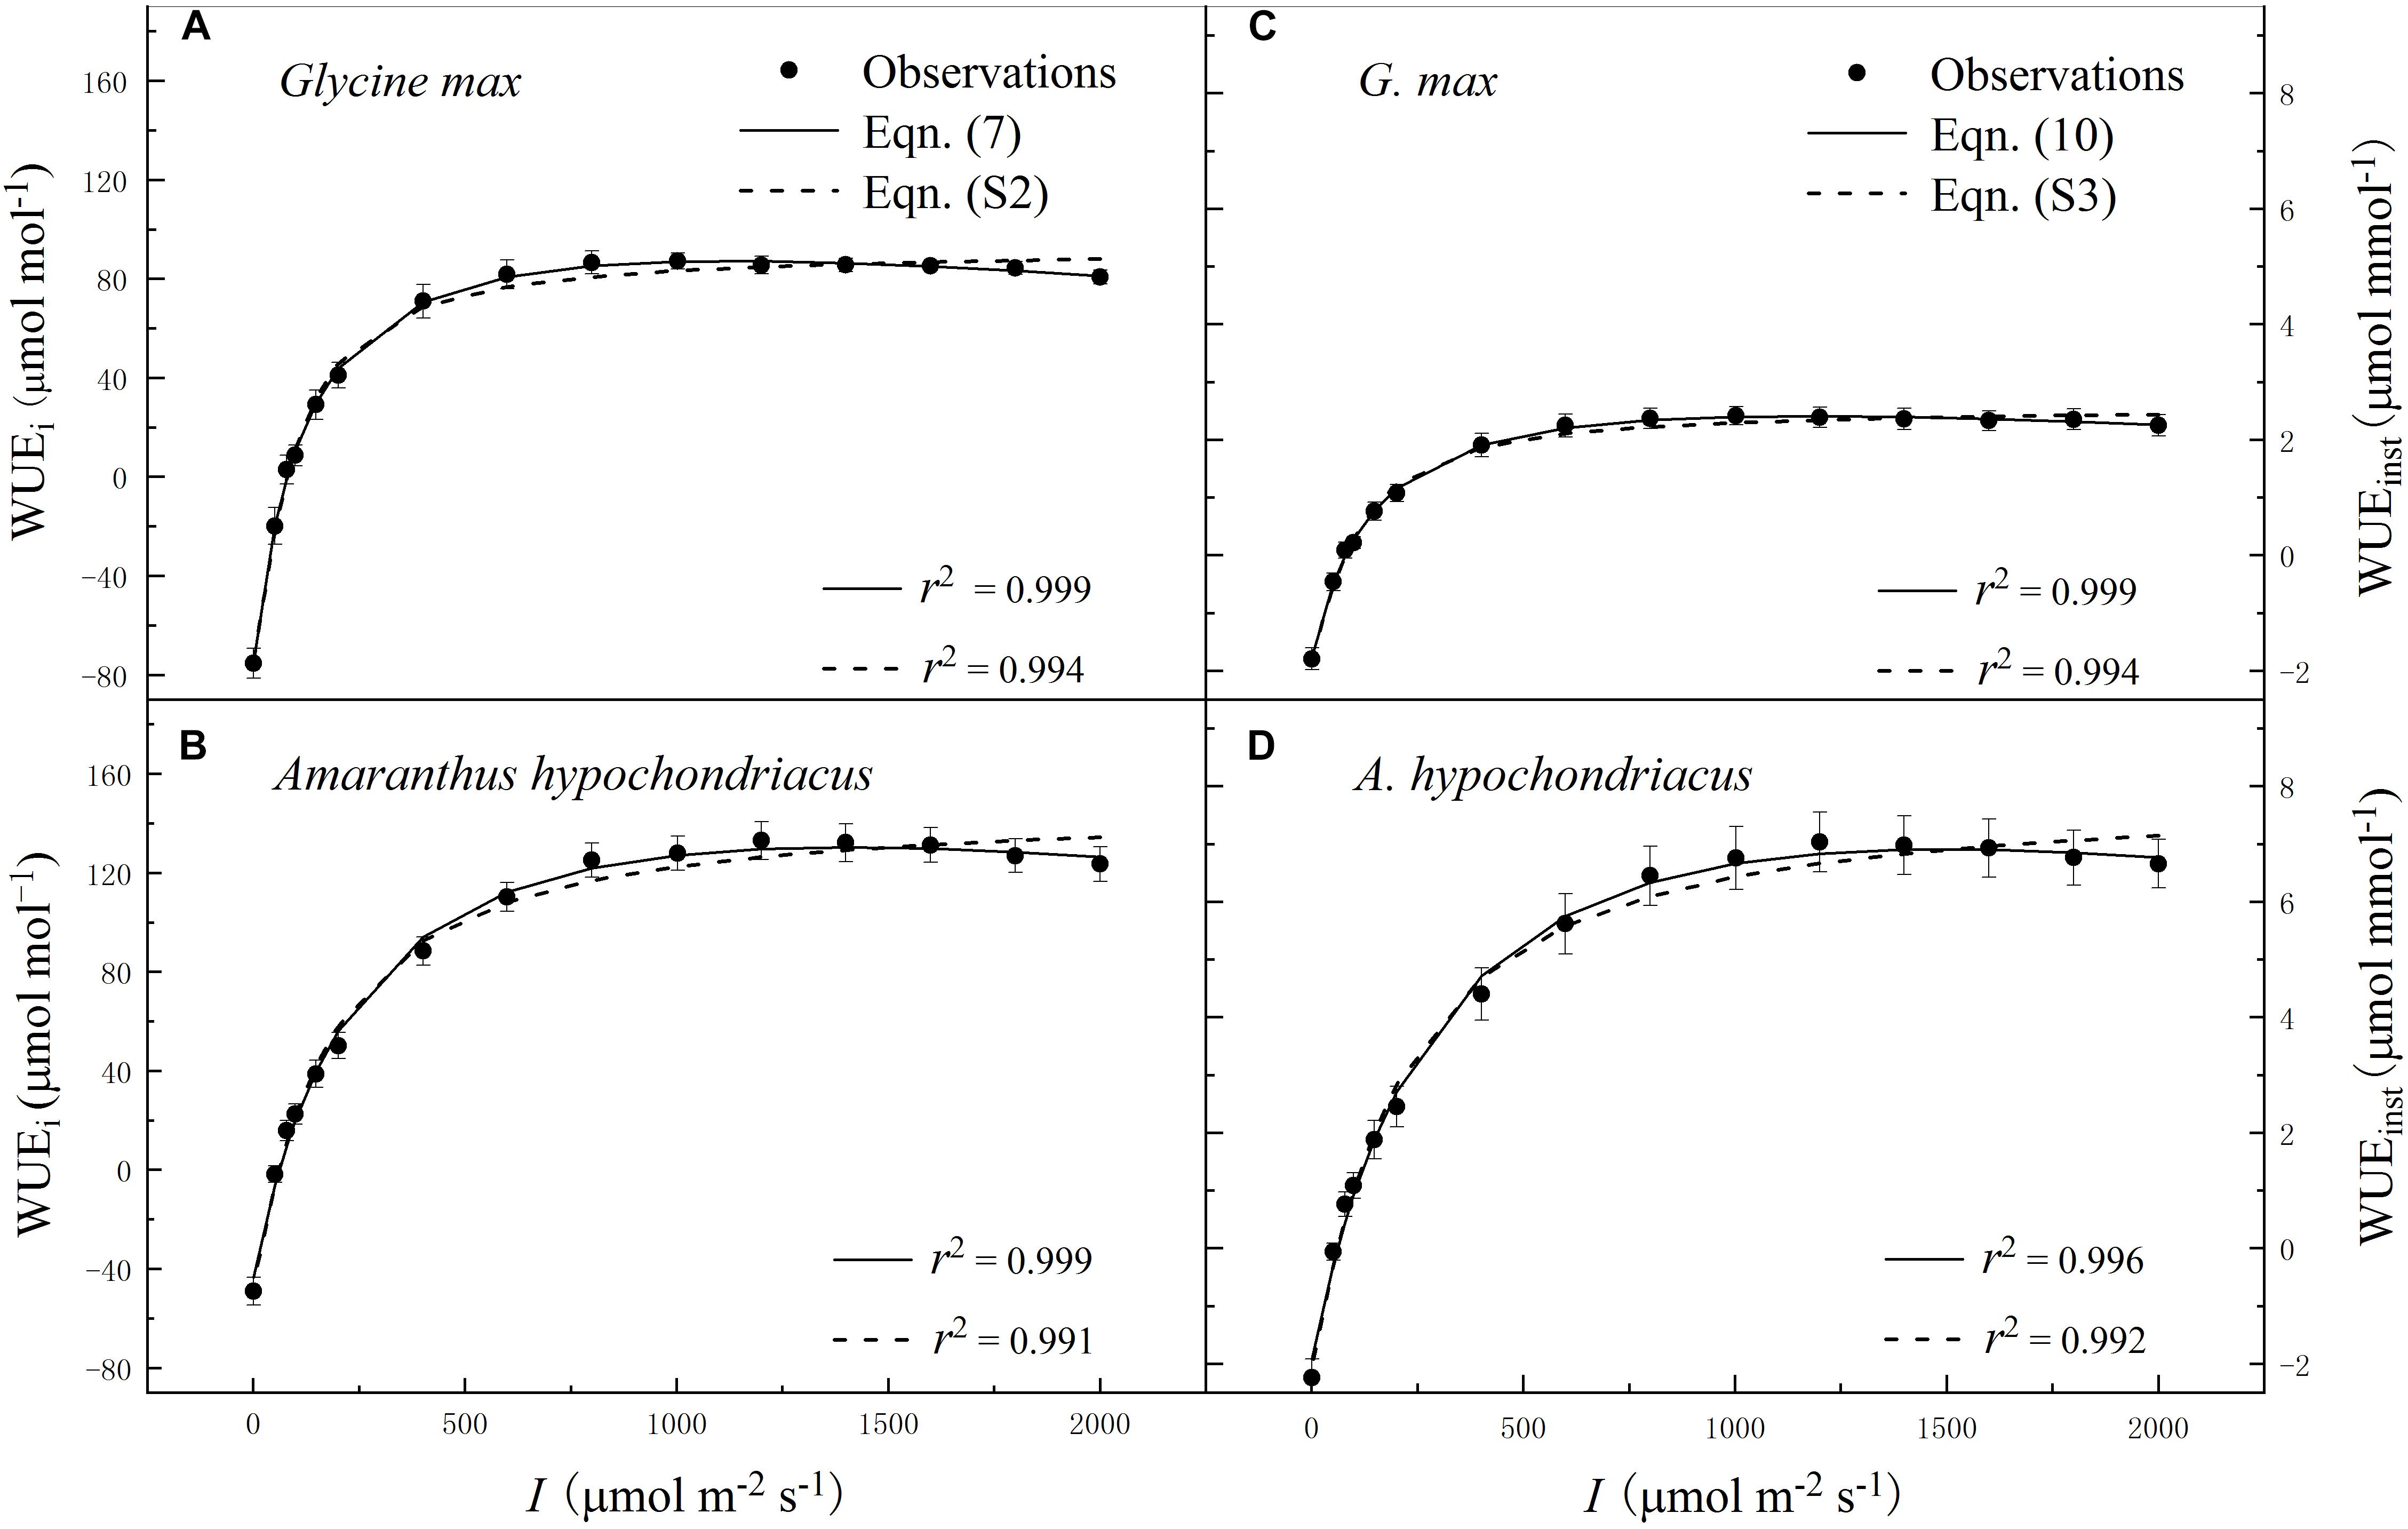
Figure 2. Irradiance (I) response of intrinsic water-use efficiency (WUEi) (A,B) and instantaneous water-use efficiency (WUEinst) (C,D) for C3 [soybean (Glycine max)] and C4 species [grain amaranth (Amaranthus hypochondriacus)], respectively. In plots (A) and (B), solid lines were fitted using Eq. 7 and dashed lines were fitted using the non-rectangular hyperbola model (Eq. S2). In plots (C) and (D), solid lines were fitted using Eq. 10 and dashed lines were fitted using the non-rectangular hyperbola model (Eq. S3). Data are the mean ± SE (n = 4).
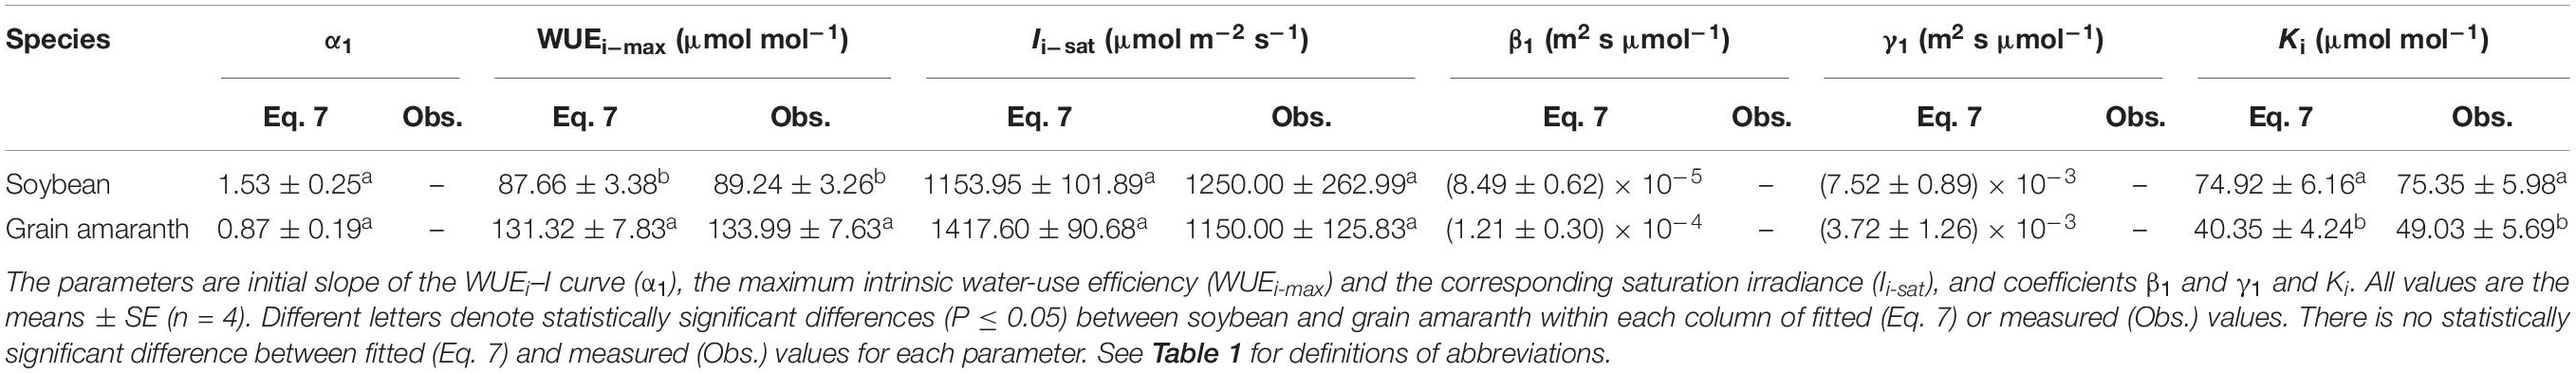
Table 4. Fitted (Eq. 7) and measured (Obs.) values of parameters defining the light response curve of intrinsic water-use efficiency for C3 (soybean) and C4 species (grain amaranth).
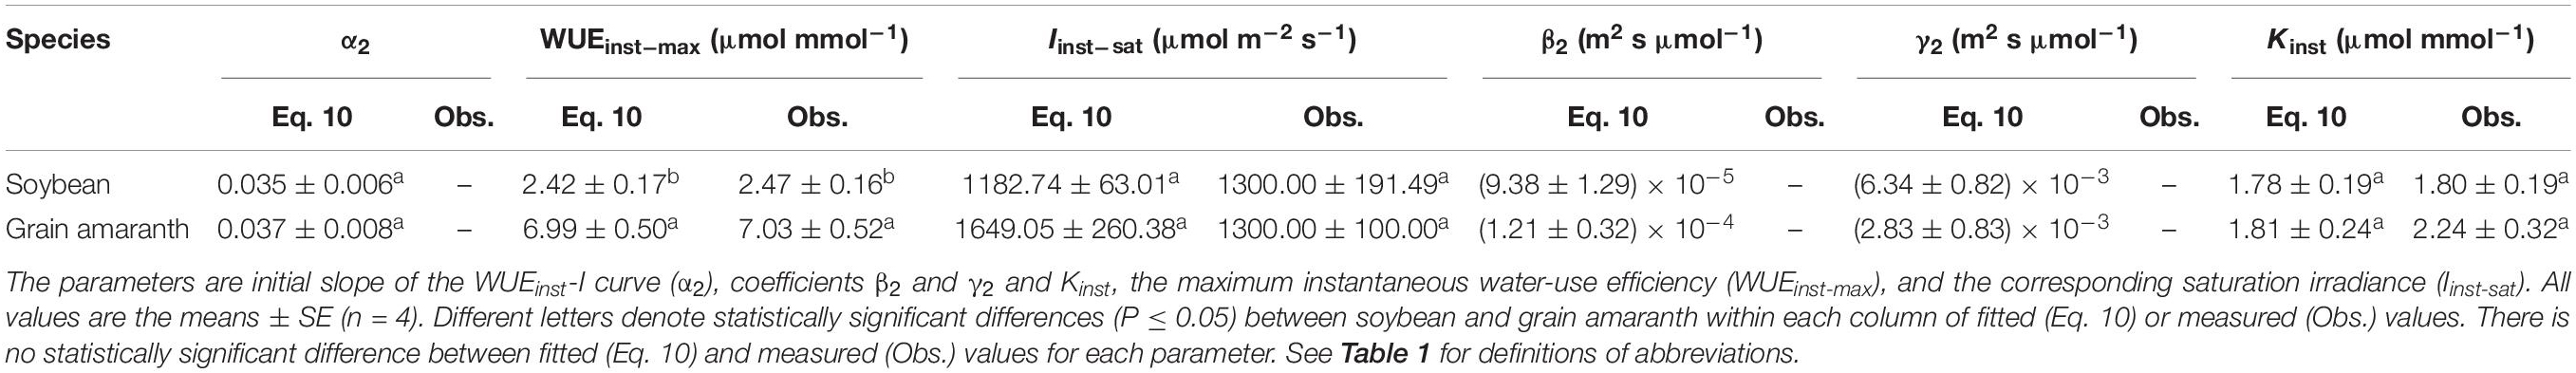
Table 5. Fitted (Eq. 10) and measured (Obs.) values of parameters defining the light response curve of instantaneous water-use efficiency for C3 (soybean) and C4 species (grain amaranth).
The high r2 values indicated that WUEi–I response curves fitted by Eq. 7—and the WUEinst–I response curves fitted by Eq. 10—were highly representative of the observations of both species (Figure 2 and Tables 4 and 5). There were no significant differences between fitted and observed values in WUEi–max, WUEinst–max, Ii–sat, Iinst–sat, Ki, or Kinst (Tables 4 and 5). Compared with Eqs. 7 and 10, the non-rectangular hyperbola model (Supplementary Eqs. S2 and S3, respectively) showed similarly high r2 values but significantly overestimated WUEi–max and WUEinst–max for the two species (Supplementary Tables S2 and S3).
Discussion
Our WUEi–I and WUEinst–I models represented cultivar-specific response curves over a wide range of light intensities extremely well (r2 ≥ 0.996), including the decline of WUEi and WUEinst beyond the saturation irradiances which the NH models cannot represent due to the asymptotic function. Our models can also return values for WUEi–max, WUEinst–max, Ii–sat, and Iinst–sat, which were in very close agreement with the measured values. The NH models cannot characterize the decline in WUEi and WUEinst induced by high light, leading to overestimations of WUEi–max and WUEinst–max (Supplementary Tables S2 and S3).
Interrelationships of Light Responses of Photosynthesis, Stomatal Conductance, and Water-Use Efficiency
WUEi and WUEinst increased rapidly within low range of I, mainly driven by the uncoupled rapidity of photosynthetic and stomatal responses (Figures 1, 2 and Tables 4 and 5; Knapp and Smith, 1990; McAusland et al., 2016). In this study, both C3 and C4 species showed 100-fold higher initial increase rate of An (α) than that of gs (α0) (Tables 2 and 3). The rapid initial increase of WUEi and WUEinst—characterized by α1 and α2, respectively—occurred at low gs (and at low I), when small increase in gs exerted the greatest impacts on An and Tr (Hetherington and Woodward, 2003). The occurrence of the greatest An and Tr increase at low gs also determined that α1 would be much higher than α2 for a given species (Figure 2 and Tables 4 and 5).
With the increasing I (from 0 to ∼800 μmol m–2 s–1), faster photosynthesis response than stomatal response led to the decline of intercellular CO2 concentration (Ci) (Supplementary Figure S1; McAusland et al., 2016), causing further opening of stomatal pores (Mott, 1988) which allowed for diffusion of ambient CO2 into the leaf (Hetherington and Woodward, 2003). Further increase of gs—beyond the low gs range—led to minimal increase of An and Tr (Hetherington and Woodward, 2003), such that WUEi and WUEinst flattened quickly after reaching the WUEi–max and WUEinst–max (Figure 2). Further increase of I beyond Ii–sat and Iinst–sat led to a decrease in WUEi and WUEinst. To reach Anmax, both soybean and grain amaranth would have to show a decrease of WUEi (or WUEinst) from WUEi–max (or WUEinst–max) (Figures 1, 2).
Differential Light Responses of Water-Use Efficiency Between C3 and C4 Species
The observation-modeling intercomparison in this study highlighted the differential single-peaked WUEi–I and WUEinst–I responses—besides differential An–I and gs–I responses—between C3 and C4 species (Figure 2 and Tables 4 and 5). C4 species (grain amaranth) showed higher WUEi and WUEinst than C3 species (soybean), suggesting its better leaf-scale optimization of carbon uptake versus water loss than C3 species (Figures 1, 2 and Tables 2, 4, and 5). This may be due to higher photosynthetic capacity and rapidity of stomatal response (α0) in C4 species under changing irradiance conditions (Figure 1 and Tables 2 and 3), which facilitate relatively closer coupling between An and gs in C4 species than C3 species (McAusland et al., 2016).
Moreover, this study identifies greater interspecific difference in WUEinst than that in WUEi—at high I range when WUEi and WUEinst flatten (Figure 2 and Tables 4 and 5). C3 species (soybean) showed larger discrepancy between its WUEi–I and WUEinst–I responses than that of C4 species (grain amaranth). This may be due to differential water use strategies between C3 and C4 species—C4 species holds smaller Tr change per unit of gs change in relative to C3 species (Knapp, 1993). These results quantitatively demonstrate that the differential WUEi–I responses between C3 and C4 species would not necessarily mirror their differential WUEinst–I responses (Figure 2).
These results support previous studies reporting that water conservation—in terms of high WUE—is an important consequence of the C4 photosynthetic pathway (besides high carbon gain rate) at different scales including single leaf, whole plant, and even whole communities (Ludlow and Wilson, 1972), contributing to the success of C4 species in high irradiance environments (Pearcy and Ehleringer, 1984; Knapp, 1993).
Model Significance
By providing (1) analytical models characterizing the single-peaked light responses of WUEi and WUEinst and (2) key quantitative traits defining WUEi–I and WUEinst–I response differences between C3 and C4 species, this study provides a practical and robust modeling approach—in a form potentially applicable to WUE–I models at whole-plant and/or ecosystem scale. In particular, the key quantitative traits—the initial increase rates of WUEi (α1) and WUEinst (α2) besides that of An (α) and gs (α0), the maximum WUEi (WUEi–max) and WUEinst (WUEinst–max) besides that of An (Anmax) and gs (gs–max), and the corresponding saturation irradiances—will directly help physiologists and modelers investigate the interrelationships among photosynthesis, stomatal behavior, and WUE under changing irradiance conditions.
Meanwhile, the above quantitative traits allow for easier and more extensive evaluation of light-intensity consequences on carbon and water relations among different species and/or PFTs. Such quantitative information, gathered on a wider range of species and/or PFTs, could allow (1) a deeper understanding of interspecific variation in light response strategies (Knapp, 1993; Hetherington and Woodward, 2003; McAusland et al., 2016), and (2) a realistic representation of adaptive WUE–I response differences among PFTs into ecosystem modeling.
The explicit models developed in this study can be viewed as an initial step toward filling the gap between investigating the trends of interspecific variation in short-term leaf-scale WUE–I responses and translating the variation into improved process representation in models of plant and ecosystem scales. The findings in this study remain to be validated (1) with species of different growth form and PFT membership (e.g., slower-growing woody species), which could hold different light response strategies (Knapp and Smith, 1989), (2) with daily and seasonal integrals and/or whole-plant estimates of WUE that sometimes could show a low correlation with short-term leaf-scale WUE observations (Medrano et al., 2015), and (3) when leaf gas exchange is subjected to compound effects of other climatic conditions in current and future climate change scenarios.
Conclusion
The newly developed models (Eqs. 7 and 10, respectively) allow robust reproduction of the differential single-peaked WUEi–I and WUEinst–I trends between C3 and C4 species and easy parameterization of key traits defining the trends (α1, Ii–sat, Ki and WUEi–max, α2, Iinst–sat, Kinst, and WUEinst–max). The models can be employed for fast and accurate assessment of plant WUEi and WUEinst responses—besides that of photosynthetic and stomatal responses using a consistent modeling framework—across all light-limited, light-saturated, and photoinhibitory light intensities. These findings are useful (1) for breeders screening for ideal genotypes target with maximized photosynthesis capacity and optimized WUE, (2) for plant physiologists quantifying intra- and/or inter-specific variation in leaf-scale WUE–I responses, and (3) for modelers working on better representation of the coupling between carbon and water processes under dynamic irradiance conditions.
Data Availability Statement
The datasets generated for this study are available on request to the corresponding author.
Author Contributions
Z-PY and S-XZ drafted the work. All authors contributed substantially to the completion of this work and critically revised the work. Z-PY, H-JK, and Y-GL secured the funding.
Funding
This research was supported by the National Natural Science Foundation of China (Grant Nos. 31560069 and 31960054), the National Key Research and Development Program of China (Grant No. 2016 YFD 03001008), the Key Science and Technology Innovation Team Project of Wenzhou City (Grant No. C20150008), and the National Natural Science Foundation of China (Grant Nos. 31860045 and 31500583).
Conflict of Interest
The authors declare that the research was conducted in the absence of any commercial or financial relationships that could be construed as a potential conflict of interest.
Supplementary Material
The Supplementary Material for this article can be found online at: https://www.frontiersin.org/articles/10.3389/fpls.2020.00374/full#supplementary-material
References
Ahrar, M., Doneva, D., Tattini, M., Brunetti, C., Gori, A., Rodeghiero, M., et al. (2017). Phenotypic differences determine drought stress responses in ecotypes of Arundo donax adapted to different environments. J. Exp. Bot. 68, 2439–2451. doi: 10.1093/jxb/erx125
Aranda, I., Pardos, M., Puértolas, J., Jiménez, M. D., and Pardos, J. A. (2007). Water-use efficiency in cork oak (Quercus suber) is modified by the interaction of water and light availabilities. Tree Physiol. 27, 671–677. doi: 10.1093/treephys/27.5.671
Avola, G., Cavallaro, V., Patanè, C., and Riggi, E. (2008). Gas exchange and photosynthetic water use efficiency in response to light, CO2 concentration and temperature in Vicia faba. J. Plant Physiol. 165, 796–804. doi: 10.1016/j.jplph.2007.09.004
Baly, E. C. (1935). The kinetics of photosynthesis. Philos. R. Soc. Lond. B 117, 218–239. doi: 10.1098/rspa.1935.0083
Bota, J., Tomás, M., Flexas, J., Medrano, H., and Escalona, J. M. (2016). Differences among grapevine cultivars in their stomatal behavior and water use efficiency under progressive water stress. Agrcult. Water Manage. 164, 91–99. doi: 10.1016/j.agwat.2015.07.016
Buckley, T. N., and Mott, K. A. (2013). Modelling stomatal conductance in response to environmental factors. Plant Cell Environ. 36, 1691–1699. doi: 10.1111/pce.12140
Buckley, T. N., Mott, K. A., and Farquhar, G. D. (2003). A hydromechanical and biochemical model of stomatal conductance. Plant Cell Environ. 26, 1767–1785. doi: 10.1046/j.1365-3040.2003.01094.x
Chen, X., Liu, W. Y., Song, L., Li, S., Wu, C. S., and Lu, H. Z. (2016). Adaptation of epiphytic bryophytes in the understorey attributing to the correlations and trade-offs between functional traits. J. Bryol. 38, 110–117. doi: 10.1080/03736687.2015.1120370
De Kauwe, M. G., Zhou, S. X., Medlyn, B. E., Pitman, A. J., Wang, Y. P., Duursma, R. A., et al. (2015). Do land surface models need to include differential plant species responses to drought? Examining model predictions across a mesic-xeric gradient in Europe. Biogeosciences 12, 7503–7518. doi: 10.5194/bg-12-7503-2015
Dewar, R. O. (2002). The Ball–Berry–Leuning and Tardieu–Davies stomatal models: synthesis and extension within a spatially aggregated picture of guard cell function. Plant Cell Environ. 25, 1383–1398. doi: 10.1046/j.1365-3040.2002.00909.x
dos Santos, J. U. M., de Carvalho, G. J. F., and Fearnside, P. M. (2013). Measuring the impact of flooding on Amazonian trees: photosynthetic response models for ten species flooded by hydroelectric dams. Trees 27, 193–210. doi: 10.1016/j.agrformet.2012.09.005
Dudley, S. A. (1996). Differing selection on plant physiological traits in response to environmental water availability: a test of adaptive hypotheses. Evolution 50, 92–102. doi: 10.1111/j.1558-5646.1996.tb04475.x
Duursma, R. A., Payton, P., Bange, M. P., Broughton, K. J., Smith, R. A., Medlyn, B. E., et al. (2013). Near-optimal response of instantaneous transpiration efficiency to vapour pressure deficit, temperature and [CO2] in cotton (Gossypium hirsutum L.). Agr. Forest Meteorol. 168, 168–176. doi: 10.1016/j.agrformet.2012.09.005
Eamus, D., Huete, A., and Yu, Q. (2016). Vegetation Dynamics: A Synthesis of Plant Ecophysiology, Remote Sensing and MODELLINg. Cambridge: Cambridge University Press, 331–333.
Egea, G., Verhoef, A., and Vidale, P. L. (2011). Towards an improved and more flexible representation of water stress in coupled photosynthesis–stomatal conductance models. Agr. Forest Meteorol. 151, 1370–1384. doi: 10.1016/j.agrformet.2011.05.019
Fischer, R. A., and Turner, N. C. (1978). Plant productivity in the arid and semiarid zones. Annu. Rev. Plant Biol. 29, 277–317. doi: 10.1146/annurev.pp.29.060178.001425
Flexas, J., Niinemets, U., Gallé, A., Barbour, M. M., Centritto, M., Diaz-Espejo, A., et al. (2013). Diffusional conductances to CO2 as a target for increasing photosynthesis and photosynthetic water-use efficiency. Photosyn. Res. 117, 45–59. doi: 10.1007/s11120-013-9844-z
Gilbert, M. E., Zwieniecki, M. A., and Holbrook, N. M. (2011). Independent variation in photosynthetic capacity as stomatal conductance leads to differences in intrinsic water use efficiency in 11 soybean genotypes before and during mild drought. J. Exp. Bot. 62, 2875–2887. doi: 10.1093/jxb/erq461
Gomes, F. P., Oliva, M. A., Mielke, M. S., Almeida, A. A. F., and Leite, H. G. (2006). Photosynthetic irradiance-response in leaves of dwarf coconut palm (Cocos nucifera L. ‘nana’. Araceae): comparison of three models. Sci. Hortic. 109, 101–105. doi: 10.1016/j.scienta.2006.02.030
Hetherington, A. M., and Woodward, F. I. (2003). The role of stomata in sensing and driving environmental change. Nature 424, 901–908. doi: 10.1038/nature01843
Knapp, A. K. (1993). Gas exchange dynamics in C3 and C4 grasses: consequence of differences in stomatal conductance. Ecology 74, 113–123. doi: 10.2307/1939506
Knapp, A. K., and Smith, W. K. (1987). Stomatal and photosynthetic responses during sun/shade transitions in subalpine plants: influence on water use efficiency. Oecologia 74, 62–67. doi: 10.1007/BF00377346
Knapp, A. K., and Smith, W. K. (1989). Influence of growth form and water relations on stomatal and photosynthetic responses to variable sunlight in subalpine plants. Ecology 70, 1069–1082. doi: 10.2307/1941376
Knapp, A. K., and Smith, W. K. (1990). Stomatal and photosynthetic responses to variable sunlight. Physiol. Plant 78, 160–165. doi: 10.1111/j.1399-3054.1990.tb08731.x
Köhler, I. H., Macdonald, A. J., and Schnyder, H. (2016). Last-century increases in intrinsic water-use efficiency of grassland communities have occurred over a wide range of vegetation composition, nutrient inputs, and soil PH. Plant Physiol. 170, 881–890. doi: 10.1104/pp.15.01472
Linares, J. C., and Camarero, J. J. (2012). From pattern to process: linking intrinsic water-use efficiency to drought-induced forest decline. Glob. Change Biol. 18, 1000–1015. doi: 10.1111/j.1365-2486.2011.02566.x
Ludlow, M. M., and Wilson, G. L. (1972). Photosynthesis of tropical pasture plants. IV. Basis and consequences of differences between grasses and legumes. Aust. J. Biol. Sci. 25, 1133–1145. doi: 10.1071/BI9721133
McAusland, L., Vialet-Chabrand, S., Davey, P., Baker, N. R., Brendel, O., and Lawson, T. (2016). Effects of kinetics of light-induced stomatal responses on photosynthesis and water-use efficiency. New Phytol. 211, 1209–1220. doi: 10.1111/nph.14000
Medlyn, B. E., De Kauwe, M., Lin, Y. S., Knauer, J., Duursma, R. A., Williams, C. A., et al. (2017). How do leaf and ecosystem measures of water-use efficiency compare? New Phytol. 216, 758–770. doi: 10.1111/nph.14626
Medrano, H., Tomás, M., Martorell, S., Flexas, J., Hernández, E., Rosselló, J., et al. (2015). From leaf to whole-plant water use efficiency (WUE) in complex canopies: limitations of leaf WUE as a selection target. Crop J. 3, 220–228. doi: 10.1016/j.cj.2015.04.002
Mott, K. A. (1988). Do stomata respond to CO2 concentrations other than intercellular? Plant Physiol. 86, 200–203. doi: 10.1104/pp.86.1.200
Pearcy, R. W., and Ehleringer, J. (1984). Comparative ecophysiology of C3 and C4 plants. Plant Cell Environ. 7, 1–13. doi: 10.1111/j.1365-3040.1984.tb01194.x
Sinclair, T. R., Tanner, C. B., and Bennett, J. M. (1984). Water-use efficiency in crop production. Bioscience 34, 36–40. doi: 10.2307/1309424
Smith, W. K., Knapp, A. K., and Reiners, W. A. (1989). Penumbral effects on sunlight penetration in plant communities. Ecology 70, 1603–1609. doi: 10.2307/1938093
Song, L., Zhang, Y. J., Chen, X., Li, S., Lu, H. Z., Wu, C. S., et al. (2015). Water relations and gas exchange of fan bryophytes and their adaptations to microhabitats in an Asian subtropical montane cloud forest. J. Plant Res. 128, 573–584. doi: 10.1007/s10265-015-0721-z
von Caemmerer, S., and Farquhar, G. D. (1981). Some relationships between the biochemistry of photosynthesis and the gas exchange of leaves. Planta 153, 376–387. doi: 10.1007/BF00384257
Wargent, J. J., Elfadly, E. M., Moore, J. P., and Paul, N. D. (2011). Increased exposure to UV-B radiation during early development leads to enhanced photoprotection and improved long-term performance in Lactuca sativa. Plant Cell Environ. 34, 1401–1413. doi: 10.1111/j.1365-3040.2011.02342.x
Webster, R. J., Driever, S. M., Kromdijk, J., McGrath, J., Leakey, A. D. B., Siebke, K., et al. (2016). High C3 photosynthetic capacity and high intrinsic water use efficiency underlies the high productivity of the bioenergy grass Arundo donax. Sci. Rep. 6:20694. doi: 10.1038/srep20694
Xu, Z. F., Hu, T. X., and Zhang, Y. B. (2012a). Effects of experimental warming on phenology, growth and gas exchange of treeline birch (Betula utilis) saplings. Eastern Tibetan Plateau, China. Eur. J. Forest Res. 131, 811–819. doi: 10.1007/s10342-011-0554-9
Xu, Z. F., Yin, H. J., Xiong, P., Wan, C., and Liu, Q. (2012b). Short-term responses of Picea asperata seedlings of different ages grown in two contrasting forest ecosystems to experimental warming. Environ. Exp. Bot. 77, 1–11. doi: 10.1016/j.envexpbot.2011.10.011
Ye, Z. P. (2007). A new model for relationship between irradiance and the rate of photosynthesis in Oryza sativa. Photosynthetica 45, 637–640. doi: 10.1007/s11099-007-0110-5
Ye, Z. P., Suggett, J. D., Robakowski, P., and Kang, H. J. (2013). A mechanistic model for the photosynthesis-light response based on the photosynthetic electron transport of PS II in C3 and C4 species. New Phytol. 152, 1251–1262. doi: 10.1111/nph.12242
Ye, Z. P., and Yu, Q. (2008). A coupled model of stomatal conductance and photosynthesis for winter wheat. Photosynthetica 46, 637–640. doi: 10.1007/s11099-008-0110-0
Zhou, S., Medlyn, B., Sabaté, S., Sperlich, D., and Prentice, I. C. (2014). Short-term water stress impacts on stomatal, mesophyll and biochemical limitations to photosynthesis differ consistently among tree species from contrasting climates. Tree Physiol. 34, 1035–1046. doi: 10.1093/treephys/tpu072
Zhou, S.-X., Medlyn, B. E., and Prentice, I. C. (2016). Long-term water stress leads to acclimation of drought sensitivity of photosynthetic capacity in xeric but not riparian Eucalyptus species. Ann. Bot. 117, 133–144. doi: 10.1093/aob/mcv161
Keywords: irradiance, leaf gas exchange, light response curve, maximum water use efficiency, model, plant functional type (PFT), saturation light intensity, transpiration
Citation: Ye Z-P, Ling Y, Yu Q, Duan H-L, Kang H-J, Huang G-M, Duan S-H, Chen X-M, Liu Y-G and Zhou S-X (2020) Quantifying Light Response of Leaf-Scale Water-Use Efficiency and Its Interrelationships With Photosynthesis and Stomatal Conductance in C3 and C4 Species. Front. Plant Sci. 11:374. doi: 10.3389/fpls.2020.00374
Received: 22 September 2019; Accepted: 16 March 2020;
Published: 24 April 2020.
Edited by:
Fulai Liu, University of Copenhagen, DenmarkReviewed by:
Mathias Neumann Andersen, Aarhus University, DenmarkDeliang Kong, Henan Agricultural University, China
Copyright © 2020 Ye, Ling, Yu, Duan, Kang, Huang, Duan, Chen, Liu and Zhou. This is an open-access article distributed under the terms of the Creative Commons Attribution License (CC BY). The use, distribution or reproduction in other forums is permitted, provided the original author(s) and the copyright owner(s) are credited and that the original publication in this journal is cited, in accordance with accepted academic practice. No use, distribution or reproduction is permitted which does not comply with these terms.
*Correspondence: Yu-Guo Liu, liuyuguo@caf.ac.cn; Shuang-Xi Zhou, shuangxi.zhou@plantandfood.co.nz
†These authors have contributed equally to this work