Fishbone 🐟 Diagram
Lean Manufacturing & Six Sigma Worldwide
Data-Driven Decisions, Lean Processe❤ Explore the power of Statistics, Lean, and Six Sigma through our engaging videos.
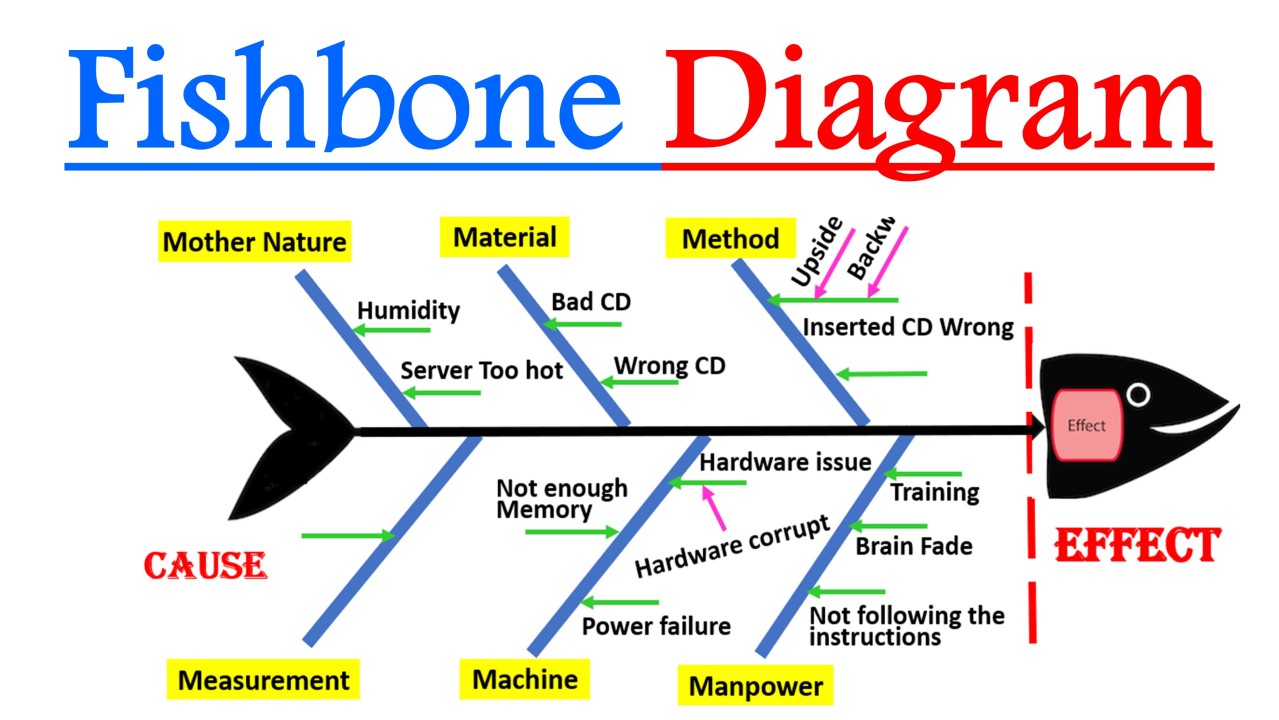
A Fishbone Diagram, also known as an Ishikawa Diagram or Cause & Effect Diagram, is a tool used to identify and analyze the root causes of a problem. It is named after its creator, Dr. Kaoru Ishikawa, who developed the tool in the 1960s as a quality control tool for the Japanese manufacturing industry.
The Fishbone Diagram is used to visually display the potential causes of a problem and their relationships to the effect or outcome being examined. The effect is typically placed at the head of the diagram, and the main causes are represented as the bones or branches of a fishbone.
The Fishbone Diagram can be created using a structured brainstorming session with a team of stakeholders who are knowledgeable about the problem being analyzed. The steps to create a Fishbone Diagram include:
- Identify the problem or effect that needs to be analyzed and write it at the head of the diagram.
- Identify the main categories of potential causes and write them as the main branches of the fishbone. These categories may include people, processes, equipment, environment, and materials.
- Brainstorm potential causes for each category and write them as smaller branches off the main branches.
- Continue to refine and expand the diagram by identifying and adding more specific causes and relationships between causes.
- Analyze the diagram to identify the most likely root causes of the problem and prioritize them for further investigation and corrective action.
The Fishbone Diagram is a useful tool for problem-solving and process improvement in a variety of industries and applications, including manufacturing, healthcare, education, and service industries. It helps teams to identify and analyze the underlying causes of problems, rather than simply treating the symptoms.
This video talks about the what is #FishboneDiagram or #IshikawaDiagram or #Cause&EffectDiagram. Don't forget to watch the real life examples. I have used animation makes it easy to understand as well. Learn how to create a cause-and-effect diagram, also known as an Ishikawa or "fishbone" diagram, to explore and display the possible causes of a certain effect.
Technical Designer III / BIM Coordinator II at TriMark USA
2moThanks! A great tool for cause and effect analysis. It’s the 5 whys methodology that Toyota Motor still using. I have used it iteratively finding the root causes onto some of my construction projects. 👍
Nice post ! We have done a video about this topic 👉 https://youtu.be/CvCTDEWTE7Q
EPL- INTERN | DATA SCIENCE | TISS-ANALYTICS 24 | Senior process engineer Adani- Wilmar| Operation and Supply chain Analytics| EX - UICT student|
10moVery effective way for root cause analysis
Diesel mechanic (Team leader) at Sandvik Zimbabwe
11moapplicable in every industry
Quality Analyst (RCM)
11moThanks for posting and briefing it