Ishikawa diagram (Fishbone Diagram)
Kuldeep Shukla
![Kuldeep Shukla]()
Kuldeep Shukla
Techno-Commercial Professional | Global Sourcing 🌏✈️| PLM♻️ | PMP🎯 | Footwear 👟, Bag💼 & Apparel | MBA- Gold Medalist🏅| Six Sigma-Black Belt🥋| Lean Manufacturing | QMS⚙️| TQM✅| Chinese Mandarin Speaker 🇮🇳🇨🇳
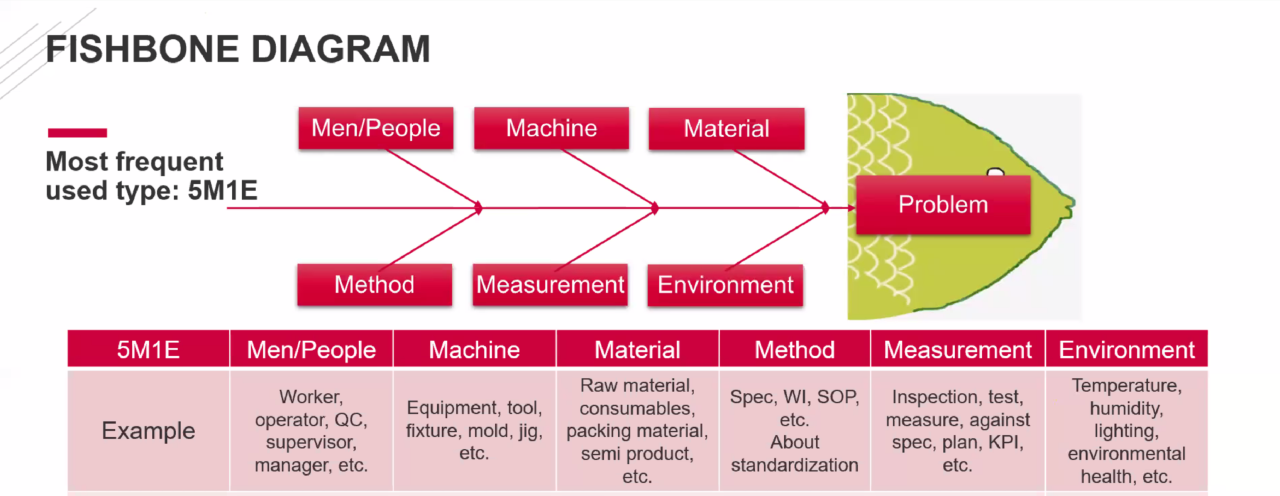
Ishikawa diagram (Fishbone Diagram, Cause-and-Effect, Herringbone Diagram or Fishikawa).
One of the eldest, useful and highly visual brainstorming tools of Problem-solving by quickly identifying the root causes in the same or different casual tree. It allows us to see all causes simultaneously.
I am used to this tool to conduct RCA (Root Cause Analysis) for production, technical and quality-related issues. Because it reveals the key relationships among various variables and the possible causes provide additional insight into process behaviour.
Fishbone diagrams are considered one of seven basic quality tools and are used in the "analyze" phase of Six Sigma's DMAIC (define, measure, analyze, improve, control) approach to problem-solving.