The Normal Distribution and Its Applications in Quality Control and Process Improvement
Mukhtar Shaikh
Immediate Joiner | Data Science | Python | Machine Learning | Statistics| Deep Learning | SQL | Power BI| Buisness Analyst
Normal distribution is a continuous probability distribution that is widely used in statistical inference, hypothesis testing, and data analysis. It is also known as the Gaussian distribution, named after the mathematician Carl Friedrich Gauss.
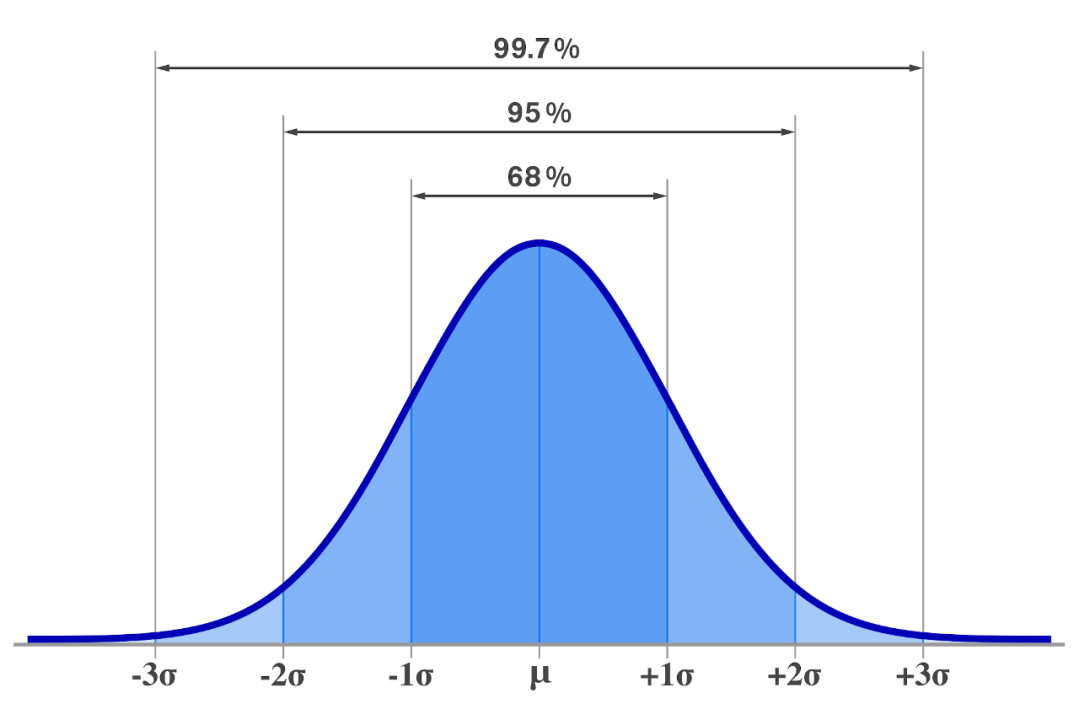
The normal distribution is characterized by its bell-shaped curve, which is symmetrical around the mean.
The mean and standard deviation of a normal distribution fully determine its shape. The mean, denoted by μ, represents the central value around which the distribution is centered. The standard deviation, denoted by σ, represents the spread or variability of the distribution. The variance, denoted by σ^2, is the square of the standard deviation.
The probability density function (PDF) of a normal distribution is given by:
f(x) = (1 / (σ√(2π))) * e^(-(x-μ)² / (2σ²))

where x is the random variable, μ is the mean, σ is the standard deviation, π is the mathematical constant pi, and e is the base of the natural logarithm.
The PDF of the normal distribution is symmetric around the mean μ and reaches its maximum value at x = μ. The standard deviation σ determines the shape of the curve, with larger values of σ producing flatter and wider curves.

The cumulative distribution function (CDF) of a normal distribution is given by:
Φ(x) = 1 / 2 * (1 + erf((x-μ) / (σ√2)))
where erf(x) is the error function, which is a special function used in mathematical statistics.
The CDF of the normal distribution gives the probability that a random variable X is less than or equal to a particular value x. The CDF is a function of x, and its value ranges from 0 to 1.

The normal distribution has several important properties:
- It is a continuous distribution, meaning that the random variable can take on any value within a certain range.
- It is symmetrical around the mean, meaning that the left and right halves of the curve are mirror images of each other.
- It is asymptotic, meaning that the curve approaches but never touches the x-axis.
- The area under the curve represents the total probability of all possible outcomes, which is equal to 1.
The normal distribution is widely used in statistical inference and data analysis due to its many desirable properties. Many natural phenomena, such as the height and weight of people, follow a normal distribution. The normal distribution is also used as a model for the sampling distribution of many statistics, such as the sample mean and sample proportion.
The normal distribution is widely used in business for various purposes, such as:
- Quality control: Many manufacturing processes follow a normal distribution, and companies can use statistical process control techniques to monitor the quality of their products. By measuring the mean and standard deviation of the process, companies can set control limits to ensure that the process stays within acceptable bounds.
- Sales forecasting: Companies can use historical sales data to estimate future sales using a normal distribution. By estimating the mean and standard deviation of sales, companies can calculate the probability of achieving different levels of sales and set sales targets accordingly.
- Financial analysis: Many financial variables, such as stock prices and returns, also follow a normal distribution. Financial analysts can use the normal distribution to estimate the expected return and risk of different investments.
- Customer behavior analysis: Companies can use the normal distribution to model customer behavior, such as the amount of time spent on a website or the number of purchases made in a given period. By understanding the distribution of customer behavior, companies can optimize their marketing and sales strategies.
- Employee performance evaluation: Companies can use the normal distribution to evaluate employee performance by comparing their performance metrics, such as sales or productivity, to the distribution of their peers. This can help identify high-performing and low-performing employees and inform performance improvement strategies.
Overall, the normal distribution is a powerful tool for business analysis and decision-making, and its versatility makes it applicable in a wide range of contexts.
How to check the normal distribution ?
To check if a given dataset follows a normal distribution, there are several methods you can use:
- Histogram: Plot a histogram of the data and visually inspect it for a bell-shaped curve. The histogram should show a smooth, symmetric distribution around the mean.
- Normal probability plot: Plot a normal probability plot, also known as a Q-Q plot, which compares the distribution of the data to the expected normal distribution. If the data follows a normal distribution, the plot should show a straight line.
- Shapiro-Wilk test: Perform a Shapiro-Wilk test, which is a statistical test that tests the null hypothesis that the data is normally distributed. If the p-value of the test is less than a significance level (such as 0.05), then the null hypothesis is rejected, indicating that the data is not normally distributed.
- Kolmogorov-Smirnov test: Perform a Kolmogorov-Smirnov test, which is a statistical test that compares the distribution of the data to the expected normal distribution. If the p-value of the test is less than a significance level, then the null hypothesis is rejected, indicating that the data is not normally distributed.
It's worth noting that these methods are not foolproof, and there can be cases where the normal distribution assumption is violated even if the tests suggest otherwise. Therefore, it's important to use these methods as a guide and supplement them with domain knowledge and judgment.
How can you make data normally distributed ?
There are several ways to transform data to make it approximately normally distributed. Here are a few common methods:
- Log transformation: If the data is positively skewed, taking the logarithm of the data can reduce the skewness and make the data more normally distributed. This can be particularly useful for data that follows an exponential distribution.
- Square root transformation: Similar to the log transformation, taking the square root of the data can reduce the skewness and make the data more normally distributed. This can be particularly useful for count data or data that follows a Poisson distribution.
- Box-Cox transformation: The Box-Cox transformation is a family of power transformations that can be used to normalize data. The optimal transformation parameter can be estimated using maximum likelihood estimation.
- Johnson transformation: The Johnson transformation is a family of transformations that can be used to transform data to a normal distribution by transforming the data into a normal space using a four-parameter transformation.
It's important to note that these transformations can be data-dependent and may require some trial-and-error to find the best transformation for a given dataset. Additionally, it's important to understand the underlying data-generating process and whether a normal distribution is appropriate for the data before transforming the data.
what can you do if the data is not normally distributed ?
If the data is not normally distributed, there are several options for data analysis and modeling, depending on the specific goals and context of the analysis. Here are a few options:
- Transform the data: Sometimes, transforming the data using a mathematical function can make it closer to a normal distribution. Common transformations include logarithmic, exponential, and power transformations. However, this approach requires some domain knowledge and understanding of the underlying data-generating process.
- Use non-parametric tests: Non-parametric tests do not assume any specific distribution for the data and are therefore more robust to deviations from normality. Examples of non-parametric tests include the Wilcoxon rank-sum test and the Kruskal-Wallis test.
- Use alternative distribution models: There are many alternative distribution models that can be used to model non-normal data, such as the Poisson, gamma, or log-normal distributions. Choosing an appropriate distribution model requires some domain knowledge and understanding of the underlying data-generating process.
- Use machine learning models: Machine learning models, such as decision trees, random forests, and neural networks, can be used to model non-normal data. These models are flexible and can capture complex relationships between the input features and the outcome variable. However, they often require larger sample sizes and more data preparation than traditional statistical models.
It's important to note that these transformations can be data-dependent and may require some trial-and-error to find the best transformation for a given dataset. Additionally, it's important to understand the underlying data-generating process and whether a normal distribution is appropriate for the data before transforming the dat