
Fatigue Failure Analysis of a Speed Reduction Shaft


1
Department of Mechanical Engineering, State University of Maranhão-UEMA, São Luís 65055-310, MA, Brazil
2
Department of Production Engineering, Federal University of Ouro Preto-UFOP, João Monlevade 35931-008, MG, Brazil
3
Department of Manufacturing and Materials Engineering, State University of Campinas-UNICAMP, Campinas 13083-860, SP, Brazil
*
Author to whom correspondence should be addressed.
Metals 2021, 11(6), 856; https://doi.org/10.3390/met11060856
Submission received: 18 April 2021
/
Revised: 9 May 2021
/
Accepted: 21 May 2021
/
Published: 24 May 2021
(This article belongs to the Section Metal Failure Analysis)
Abstract
:The mining industry sector is notable for the severe service loads and varied environmental conditions that it imposes on its equipment and mechanical systems. It has become essential to identify the causes of failures and use the information to avoid similar failures and improve projects. In this paper, a study on shaft failure in a speed reduction box was carried out. A section of a fractured shaft made of hardened austempered steel was analyzed to determine the cause of the break. Fractography was performed to characterize the failure mode on the fracture surface. The microstructural analysis and hardness profile revealed that the shaft was inadequately heat treated, resulting in low resistance microstructures and the development of a thin layer of bainite at the shaft edge. Large amounts of inclusions were found in the fracture region, and the tensile tests revealed that the material had an elongation below the specification. The analyses showed that the combination of factors of a large amount of inclusions present in the low resistance banded structure, and the presence of concentrated pores in that same region, acted in a synergistic way to decrease the fatigue resistance and fatigue life of the shaft material.
1. Introduction
With the advancements in engineering and manufacturing processes over the years, the performance of mechanical components such as bearings, gears, and shafts has been improved. Such advancements were possible with the know-how acquired over many years from the continuous analysis of engineering failures. As part of this analysis, it is fundamental to identify the causes of a failure to prevent similar failures in the future. There is a methodology in engineering for analyzing disasters called forensic engineering. It can be considered a failure analysis for the investigation of materials, structures, and components that may cause damage to installations and harm people. The main goal of forensic engineering is to identify the sequence of events that led to the ultimate failure, based on the design and operating conditions of a component [1,2,3,4]. In this sense, forensic engineering is a science that deals with the relation of scientific facts/engineering, to determine the causes of the failure of a product that was designed and manufactured under technical specifications and standards [2]. Thus, this methodology may consist of carrying out tests and characterizations to promote the improvement of a component or in pointing out the mode, mechanism, or causal factors of a particular failure, in order to make preventative recommendations and avoid future recurrences [1,2,5,6].
However, most studies on the failure of parts and mechanical structures are not easily accessible in the academic literature, since the industry and manufacturers try not to disclose the disadvantages of their products. On the other hand, it is crucial to share case studies, in order to prevent accidents and to improve current designs.
Particularly, mining industries require the proper arrangement of rotation, power transmission, and high torque in speed gearboxes working under a wide range of severe conditions to activate heavy machinery. One of the main causes of speed reduction system failure is the damage and fracture of their shafts [7,8]. These shafts are used to transmit power to other mechanical elements in different operating conditions, being generally subjected to torsion and sometimes combined with flexion loads in cases of mechanical misalignment. One of the most common failure mechanisms in shafts is fatigue. Fatigue failure starts in vulnerable points, such as structural and metallurgical defects, leading to high local stresses [9]. Studies conducted on shafts have shown inclusions [8,10,11], inadequate microstructures [12] and heat treatment [7], and incorrect assembly [13] as the main causes of early failure by fatigue. These types of failures can result in a serious injury to operators and workers close to the equipment. Therefore, from the view of forensic engineering, the present study aimed to conduct a systematic analysis of the failure of an output shaft from a speed reduction box belonging to a Brazilian mining industry. The analysis of the fractured component was supported by fractographic examinations; optical microscopy (OM), scanning electron microscopy (EDS/SEM), and optical emission spectrometry techniques; inclusion analysis; and hardness, microhardness, and mechanical tensile tests.
2. Background and Information of the Failure
In August 2018, the output shaft of a speed reducer fractured during operation. The shaft was designed to work uninterrupted coupled to the driving drum of a conveyor belt used by a mining company. For normal operating conditions, the design life of the speed reducer was 40 years, however, failure occurred in less than 1 year. Table 1 presents the operational parameters required by the conveyor belt drive drum. The company’s maintenance engineer reported that there was no history of premature failure, and before the shaft broke, the speed reducer had undergone a scheduled maintenance. Although the reasons for the failure could be assigned to one or many aspects, such as material selection, a mechanical property, manufacturing process, operating mode, service environment, etc., the main factor should be confirmed when investigating the equipment. Fundamentally, the reduction box system consists of an electric engine, which transmits power to the input shaft of the reduction box, which through internal worm gears, transmits power to the output shaft. A representation of the system is shown in Figure 1a and the fractured output shaft that was investigated is shown in Figure 1b, with details of its dimensions and location of the plane fracture.
When the two fractured parts were transported, the fractured surfaces were protected to prevent damage. One of the parts was cut about 10 mm from the plane of fracture in order to obtain a sample to perform the analysis [14]. The other part of the shaft remained stuck in the assembly structure and was compromised during the removal process. Part of the reduction box was damaged when the shaft broke. The fractured shaft can be seen in Figure 2. There was no evidence of direct obstruction by the interference of the shaft rotational movement through the bearings. Thus, the fracture of the output shaft was probably the main contributor to the failure of the speed reduction box.
3. Experimental Methods
For failure analysis, the region of rupture was first taken for a visual analysis. The cleaning procedure of the sample consisted in washing it with water and detergent, and subsequently immersing it in alcohol under ultrasonic agitation to remove the lubricating oil and the iron ore impurities present in the reduction box. In this sequence, the sample was put in a HCl solution and then in a KOH solution to remove oxidation from the fracture surface. A Microscope EVO MA15 (Zeiss, Oberkochen, Germany) model was used for scanning electron microscopy (SEM) analysis; the fractography was obtained with the secondary electron detection mode. Samples for microstructural and mechanical characterization and chemical analysis were withdrawn from the other region of the shaft, as shown in Figure 3d.
The metallographic preparation consisted of wet sanding using successive abrasive SiC sandpapers with a grain size from #100 up to #1200 and polishing with a 1 µm diamond paste. The microstructure was revealed with Nital etchant (2% of nitric acid in ethyl alcohol for 25 s), followed by rinsing with ethyl alcohol and drying with a hot air stream. An inverted metallurgical microscope Olympus model 41GX (Olympus Co., Tokyo, Japan) was used to observe the structures, as well as the inclusions (ASTM E45-13 [15]). The microstructure was also analyzed with SEM with a secondary electron detection mode. Hardness measurements were carried out from the center to the periphery of the shaft using a Pantec RSB Rockwell C (Panambra, São Paulo, Brazil) hardness tester with a 210 kgf load. The microhardness of the phases was obtained by using a hardness tester Shimadzu HMV-5 (Shimadzu, Kyoto, Japan) using a 98.07 mN load. The tensile tests (ASTM E8/8M-15 [16]) were performed employing flat specimens with a gauge section of 6.25 × 6 mm and a gauge length of 32 mm and a Universal Tensile Machine EMIC (Instron, São José dos Pinhais, Brazil) of 100 KN at a strain rate of 15 mm/min and load application speed of 18 MPa/s. The chemical analysis was obtained using the optical emission technique using a SPECTROMAXx (Spectro, NW, Germany) spectrometer.
The determination of nonmetallic inclusion content was obtained by the worst field approach and according to the ASTM E45-13 [15] standard. Samples were taken longitudinally from the core and shaft edge, close to the fracture region, and underwent the same metallographic procedures, except for the etching procedure. For this analysis, the standard demands an image with 100× magnification. Thus, the analysis was performed in fields of 0.5 mm2 (search for the worst field) of the sample to define the four categories or types of inclusions (sulfide, alumina, silicate, or globular oxide). The inclusions were separated into two classes (fine series and coarse series) and divided into severity levels (0, 0.5, 1.0, 3.0) according to the standard reference tables. The frequency distribution of the non-metallic inclusions area, located at the surface of the shaft, next to the fracture plane, was also determined. It is important to note that maximum shear stresses occur at the surface region of shafts [17]. Thus, using the image analysis software ImageJ [18], more than 1000 inclusions were evaluated, using non-attacked MO micrographs. Morphological parameters such as average size, maximum size, and circularity were evaluated.
4. Failure Analysis and Experimental Results
4.1. Visual Observation
A visual analysis of the shaft in the received condition was performed to evaluate the conditions of the material after fracture. Figure 3 shows a side and front view of the fractured shaft. In Figure 3a, it can be observed that the shaft underwent plastic deformation on the longitudinal surface, indicated by the red arrow, due to a high overload causing a change in its circumference uniformity [10] and deformation at the region of the fracture. Analyzing the high plastic deformation of the shaft’s fit location with the reduction box (red arrow Figure 3a) indicates that when the shaft broke there was an abrupt misalignment of the coupled gears, leading to an overlap of the teeth from the drive and driven gears. Most of the fracture surface (central and border region, near the crack nucleation area; indicated by green arrows) in Figure 3b presents a low cycle fatigue fracture which was similarly reported by Pantazopoulos et al. [19]. The remaining fractured area suffered a plastic deformation and ductile fracture, with an instant rupture caused by shear stress overload, as also observed in [8,20,21].
4.2. Chemical Analysis
Samples of the border and core regions of the shaft were used for the chemical analysis by optical spectrometry. The elements and their percentages are shown in Table 2. Comparing the chemical analyses of both aforementioned regions, a similar composition of the elements can be realized, i.e., there is no evidence of macrosegregation and an absence of signs of carburizing on the shaft surface. The chemical analysis confirmed that the material presents a typical composition of a low-alloy steel AISI/SAE 4320 [22]. This type of steel is commonly used to produce shafts and gears.
4.3. Fractographic Analysis
The fracture surface after the cleaning procedure is presented in Figure 4a. The unevenness between the highest and the lowest point at the fracture surface was about 25 mm. The macroscopic pattern of the fracture revealed the occurrence of fatigue fracture morphology caused by rotating-bending loads (Figure 4b,c). The fatigue crack propagation occupied approximately 40% of the total gauge area and the overload failure (60% of the total gauge area) presented a plastic deformation region, as indicated by the red arrow in Figure 4b. The detailed evaluation of the fracture surface allowed the identification of some characteristics of fatigue failure: (I) ratchet marks (Figure 4c), which indicate the result of multiple origins of fatigue crack nucleation due to the high stress concentration; and (II) beach marks (Figure 4c), which constitute the progression of fatigue cracks, indicating the variation in the crack growth rate. These fractographic features of fatigue fracture were also reported by other researchers [23,24]. The fatigue mechanism was fairly consistent with rotating-bending loading, and the extension of the fatigue zone in the shaft was typical for moderate load conditions [23].
An important fractographic characteristic was that the main fatigue crack grew from the surface of the shaft (Figure 4c, see white ellipse), following a slightly helical path towards the center. In general, this propagation morphology is associated with flexion/torsion loads on rotating shafts [3,4,5]. Regarding the beach marks, they showed a very pronounced texture, with a very clear interspacing between the marks. This texture aspect is associated with the low cycle fatigue (LCF) mechanism [5]. In LCF, crack propagation occurs under stresses above the flow limit of the material, promoting failure during a reduced number of cycles [25,26]. In addition, it should be noted that in the case of rotary shafts, such as the one in the present study, each point on its surface is subjected to a tensile stress and, subsequently, a compressive stress, for each revolution carried out [17]. This type of alternate loading explains the nucleation of the crack at the shaft surface and its propagation towards the center [3,5].
The fracture was divided into specific areas called: Zone A, which represents the part of the fracture surface damaged by the overload, and which causes damage, and the micromechanism of rupture modified due to friction of the two shaft halves at the time of break; Zone B, corresponding to the fatigue zone; Zone C, which is also the region of the overload fracture (Figure 4b) but where the micromechanism fracture was not modified, allowing fratographic analysis.
The SEM analysis validated the operation of the fatigue mechanism typical characteristics of cracks nucleation and fatigue growth (Zone B), as shown in Figure 5: (a) ratchet marks showing cracks nucleation, which join to form the main fatigue from the edge shaft; (b) the cyclical propagation of the crack front due to the friction forces between the fracture surfaces; and (c) possible fatigue striations indicating the progress of a crack front after an increment of crack propagation, where each increment of propagation is due to a stress cycle. Zone C, which corresponds to the overload rapid fracture, presented an aspect of gross fracture, and presented secondary cracks, as shown in Figure 5d, caused by high and unbalanced stresses at the moment of component break [12]. An evaluation by SEM revealed quasi-cleavage as the dominant fracture micromechanism of the final overload area of the shaft, according to Figure 5e; in this zone the characteristics of fragile cleavage facets combined with the distribution of ductile areas by dimples (Figure 5f,g), and these characteristics were consistent with transgranular fractures. Another observation was the presence of many inclusions inside the dimples and cleavage facets (Figure 5h), where they had a harmful effect on the material’s toughness and accelerated the fracture process, as these act as local stress concentrators [11].
It is worth mentioning that the presence of ratchet marks is strongly related to fatigue [5]. Ratchet marks are small cracks that originate and grow in planes where the maximum shear stress occurs [5]. In addition, these are directly influenced by the intensity of the stress concentration for a given critical section and correspond to Stage 1 of fatigue [5,27]. Observing Figure 4c, it is possible to visualize the ratchet marks region, indicating that in this place there was a stress concentrator (white ellipse 1). However, it should be noted that according to the location of the fracture plane on the shaft (Figure 1b), this position did not contain geometric stress concentrators (e.g., key or diameter change). The fracture plane was reasonably far from geometric discontinuities (Figure 1b). Furthermore, in the visual inspection stage, it was found that the surface of the shaft (Figure 2) had a good surface finish (low roughness). The shades of brown, red, and black colors on the shaft surface were probably only due to the lubricating oil used in the reduction box and to the mining company’s environment, which is rich in iron ore. According to Zerbst et al. [9], fatigue cracks always start in places with greater local deformation, such as: macro-notches, machined holes, grooves, section transitions, etc.; however, the stress/deformation concentration will be further increased due to the presence of defects in the material. Therefore, it seems that the steel may have had metallurgical defects generated in its manufacturing processes. This was verified with the microstructural and mechanical analyzes in the next sections.
4.4. Metallographic Analysis
The macrostructure in the cross-section of the shaft revealed a hardened layer indicating that the component was submitted to heat treatment (Figure 6a). The hardened layer was not uniform along the cross-section, and in some places a width with less than 1.0 mm was found (regions indicated by the red arrows). In accordance with the inclusion classification (ASTM E45-13 [15]), numerous inclusions of thin and thick globular oxides (Type D) were present, with a severity of 3.0 for both, and some Type B inclusions (alumina) (Figure 6b) were observed with a severity of 0.5 (as shown in Table 3). Figure 6b was obtained close to the shaft edge. Such a large number of inclusions is not desirable, because they can act as stress-concentration areas, which can lead to crack nucleation [10]. The stresses in the vicinity of an oxide inclusion are potentialized because of their size [11]. According to Figure 6c, the inclusions presented an area frequency distribution, which was very close to an exponential distribution. In addition, the average circularity of 0.8 indicates that the inclusions approached a spherical shape; circularity equals 1, a perfect spherical form. This result is in agreement with the inclusion classification analyzes (Table 3), which showed a strong presence of globular oxides. In this sense, it is also likely that the circularity was affected by the presence of sulfide inclusions, which tend to exhibit a more elongated morphology [28].
As the morphology of the inclusions was almost spherical, the inclusion size was calculated using the formula of the equivalent diameter DI (µm) of the projected area A (µm2), given by Equation (1) [28]:
Thus, using the mean and maximum area values of the analyzed inclusions (Figure 6c), the mean and maximum inclusion size was 19 and 66 µm. From observing Figure 6c, it is evident that the vast majority of inclusions had an area smaller than 500 µm2 (size of 25 µm). Therefore, the critical parameter of inclusion size was verified [29], related to the threshold value for the propagation of fatigue cracks. This critical value was around 50 to 100 µm [30]. However, when the inclusions were just below the surface, inclusions smaller than a 45 µm fracture were responsible for fatigue [31].
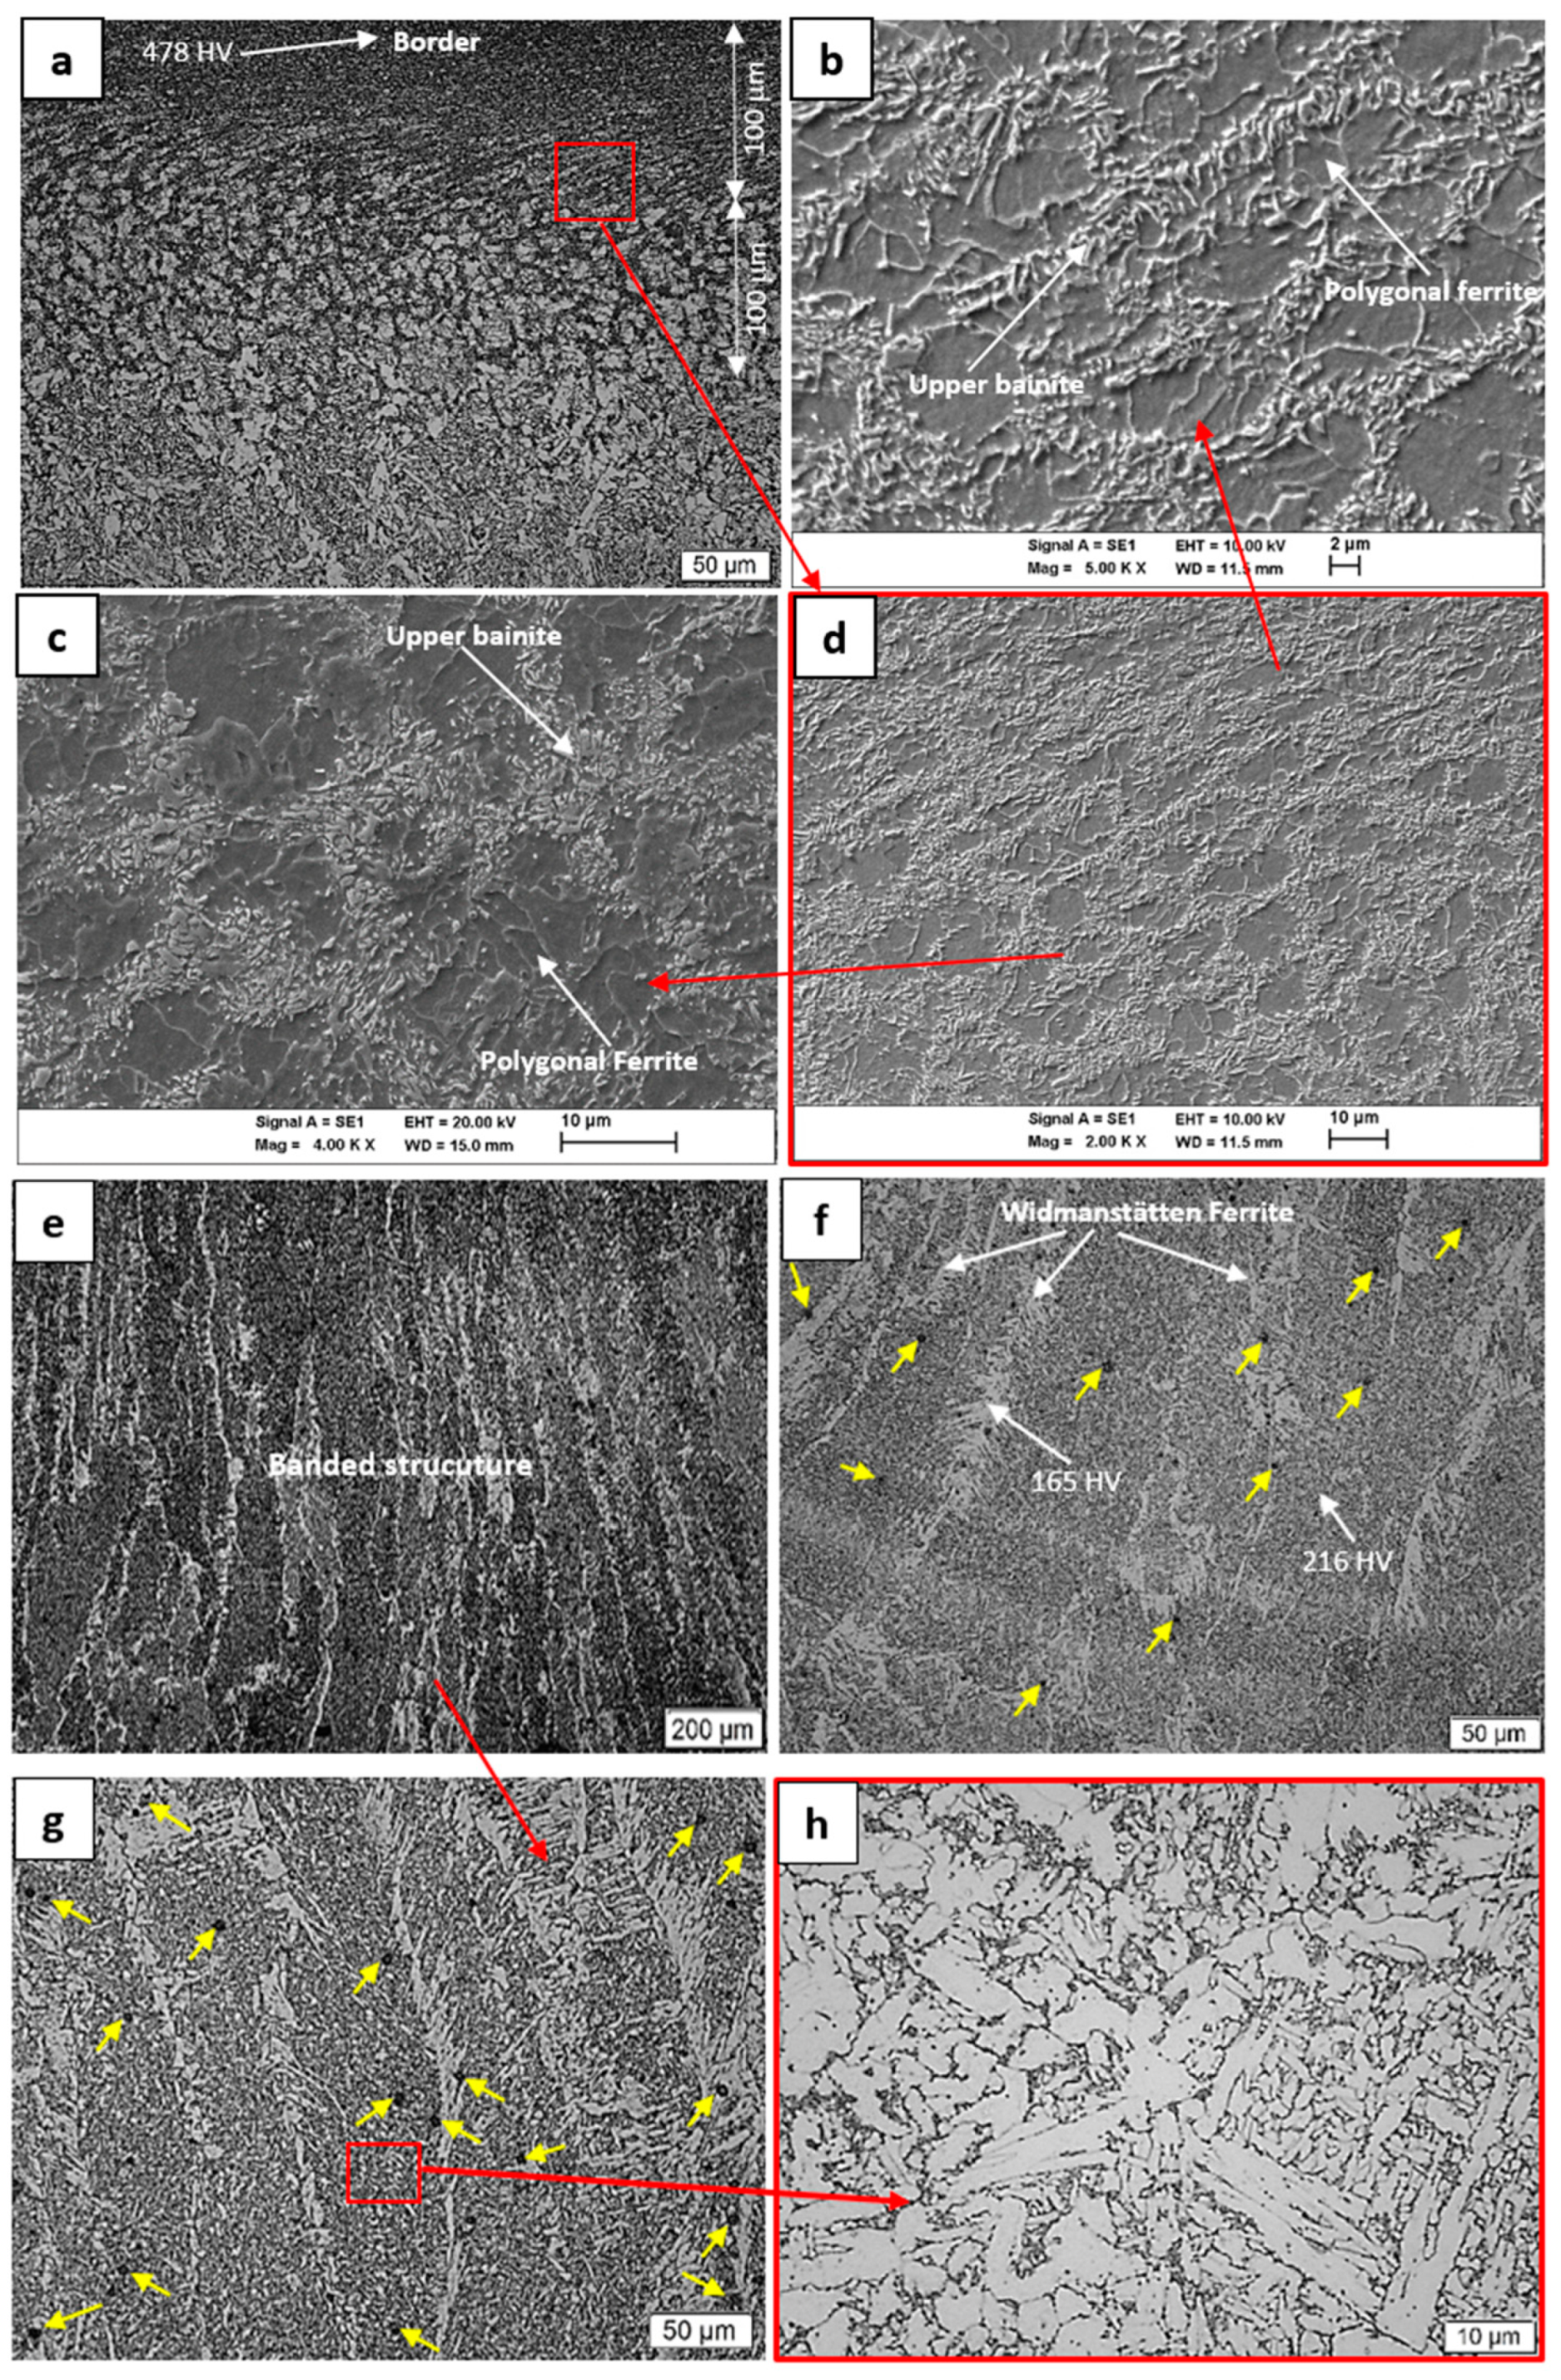
An overview of the hardened surface layer metallography of the shaft is shown in Figure 7. It presented a gradual variation of the microstructure up to the first 4000 µm; after that depth, the microstructure remained unchanged, without any significant changes until the core of the shaft. The microstructural characterization was performed in the regions indicated as 1 to 5. Region 1, corresponding to the shaft surface, indicated the presence of a 200 µm bainite layer, where the first 100 µm presented an upper bainite matrix with small sites of polygonal ferrite, and in the subsequent 100 µm, the bainite was irradiated at the limits of the old austenite grain border in the polygonal ferrite matrix (Figure 8a–d). The shaft edge has a microhardness of 478 ± 12 HV. However, due to the suffered overload, this region presented a highly elongated granulation zone. Additionally, no signs of decarburization were observed (Figure 8a,d). The presence of a distorted granulation may have led the material to exhibit residual tensile stresses on the shaft surface and controlled the development of microcracks and fatigue cracks.
Region 2 shows a pattern of banded structure that extends up to the phase boundary line (Figure 7). Figure 8e presents a quasi-polygonal ferrite matrix [32] in a dark color, and the white Widmanstätten ferrite in white, arranged in bands (Figure 8f,g). The matrix of quasi polygonal ferrite has grains with a non-uniform distribution and irregular shapes (Figure 8h). The matrix presented a microhardness of 216 ± 14 HV, and the Widmanstätten ferrite, a microhardness of 165 ± 9 HV. Additionally, in a banded structure zone, some tracks of polygonal ferrite were nucleated with a small amount of pearlite within the limits of the ferrite grains and the microstructure is detailed in Figure 7b,c. The microstructure also exhibited a low microhardness, with a value of 159 ± 11 HV.
Considering the characteristics of the structure arrangement in bands and the low microhardness due to the two phases (polygonal ferrite and pearlite, Figure 7c), just beneath the high resistance surface layer in region 1, it is evident that this microstructure is inadequate for this type of application. The heat treatment aimed at increasing the superficial resistance of the shaft material was poorly executed.
The literature states that non-uniform microstructures can be quite harmful to the mechanical properties of engineering components [33,34,35]. In addition, there are reported cases of reduced fatigue life due to phases and/or constituents with very distinct hardnesses [34,36,37]. Under cyclic loads, which is the case of the shaft in this work, there is a deformation mismatch between the different microstructures, which have a great difference between their mechanical strengths [33,36,37]. Thus, voids and cracks are easily formed when a material is composed of very soft and very hard constituents [38,39]. Zhang et al. [36] studied the growth of fatigue cracks in the mixed microstructure of a train wheel, formed by upper bainite and perlite, and which were produced by incorrect heat treatment in the manufacturing stage. The authors reported that the non-uniform deformation between the upper bainite and perlite resulted in a concentration of stresses at the interfaces of the two constituents, favoring the formation of cracks and reducing the life by fatigue. Therefore, as the shaft material presented microstructures with very different hardnesses, such as bainite (478 HV) from Region 1 and ferrite from Region 2 (159 HV), the deformation mismatch between these structures may be raised. In addition, it is reasonable to affirm that crack propagation possibly occurred at the contours of these phases.
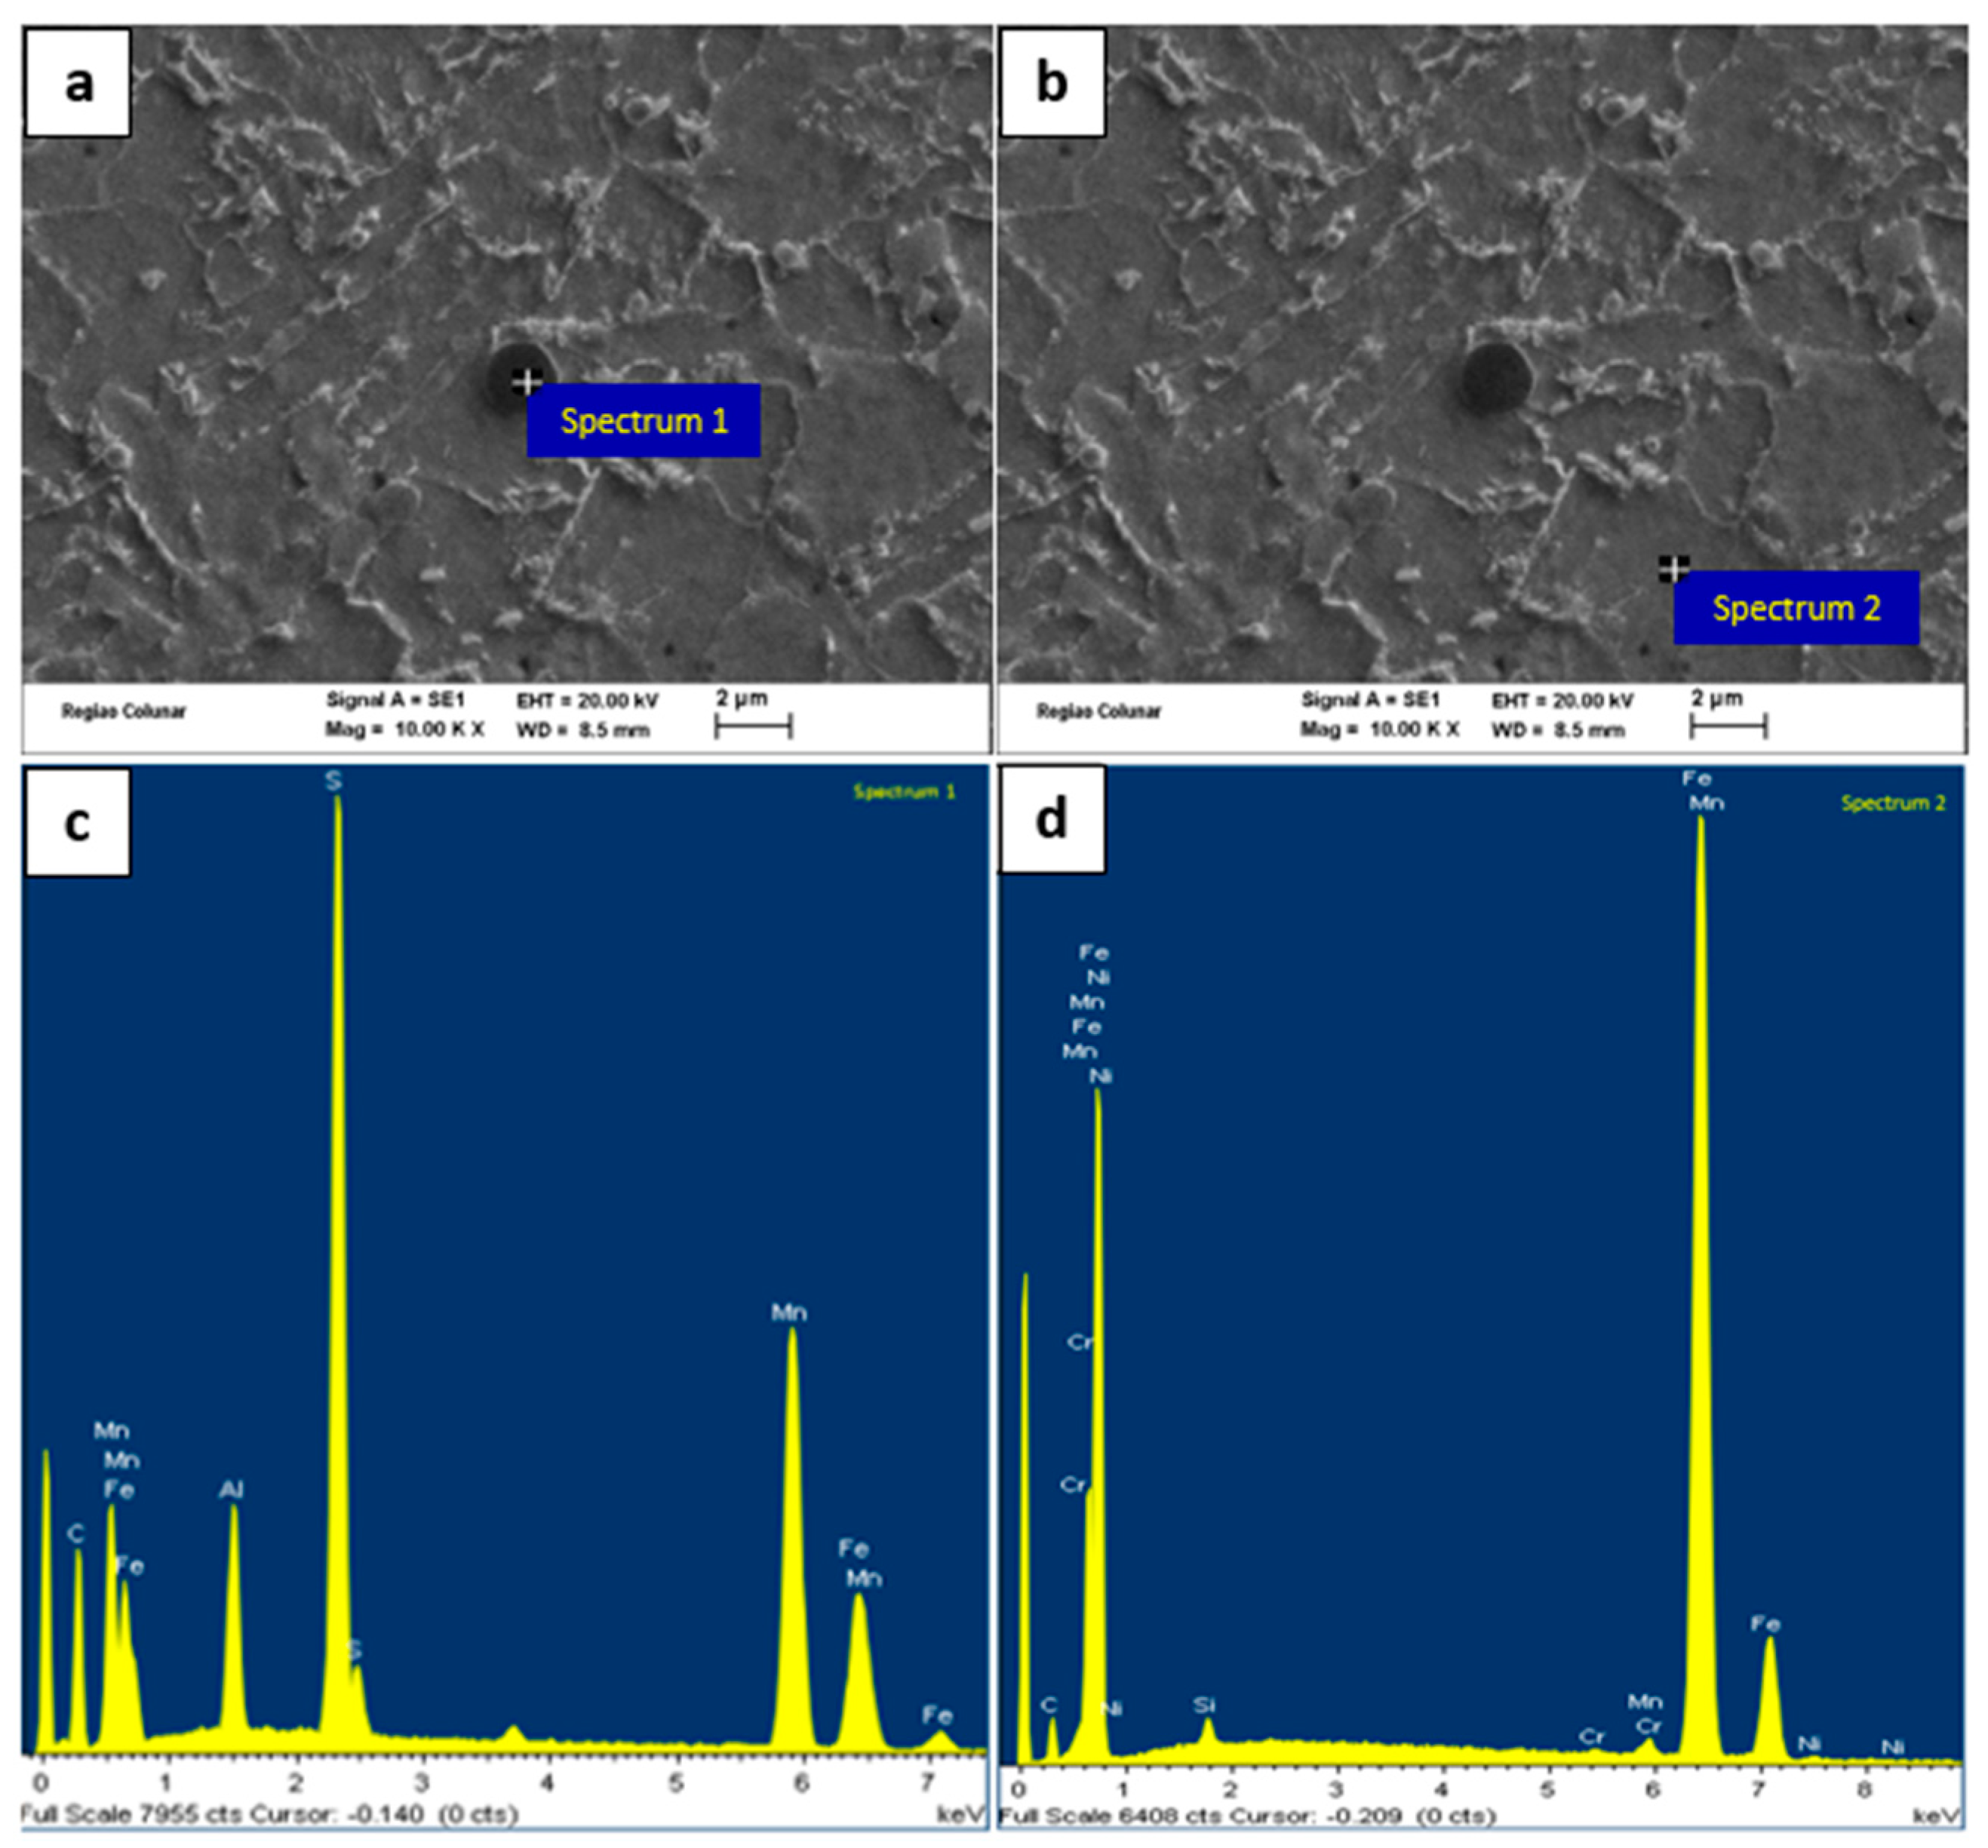
It is important to mention the existence of the high amount of inclusions distributed in the matrix (indicated by the yellow arrows in Figure 8f,g). The chemical composition of these inclusions was evaluated by EDS, although it is a semi-quantitative technique. Figure 9 shows the SEM image of an inclusion indicating the points of analysis and the spectrum. Large amounts of manganese (Mn), silicon (Si), sulfur (S), aluminum (Al), and oxygen (O) were detected in the inclusion, and the results are summarized in Table 4. The presence of these elements indicates that the inclusions were composed of oxides and sulfides formed by these elements. The high iron content observed in the analysis was due to the interference of the ferritic matrix during the analysis in SEM.
The microstructure located in region 3 is shown in Figure 10. It represents the transition of a banded structure to the microstructure formed by a martensite matrix, with some upper bainite colonies in the old austenitic grain boundary (Figure 10a,b,d). The martensite matrix presented a microhardness of 407 ± 31 HV (Figure 10c). Considering the width of the layer of this microstructure in the shaft material, it indicates that the nucleation of the banded ferrite structure above the boundary line of phases undesirably emerged and was caused by poor heat treatment, since the constituents of the banded structure commonly nucleate through diffusion mechanisms. Thus, it can be stated that the heat treatment carried out in the shaft was austempering, and thermal oscillations probably occurred in the isothermal bath temperature during the treatment. It is recommended to use an appropriate heat treatment to ensure the uniformity of the hardened layer microstructure, through an increase of the bainitic phase layer extension by isothermal treatment or carburizing, since steel SAE 4320 has a low carbon content.
After the phase boundary line in region 4, bainite colonies disappeared and give way to only martensite phase (Figure 11a,b). Region 5 comprises the microstructure around the shaft core, which consists of ferrite–acicular (light gray) and pearlite (dark) (Figure 11c,d); the pearlite is dispersed in the boundaries of the grains and as plates within the ferrite matrix. The structure presented a microhardness of 247 ± 11 HV, which is a normal value for a shaft core for this type of application.
4.5. Mechanical Properties
Results of the tensile tests are shown in Table 5. These results were compared with the specification, i.e., the expected values of this material for shaft application according to the reference [13]. The ultimate tensile strength (UTS) of the samples, the area reduction, and the yield strength (YS) had the values of the specification, but the 17.5% elongation was less than the specified range of variation. Therefore, the material did not totally accomplish the technical requirements. The test results probably were negatively affected by the large number of inclusions present in the material. The distribution of inclusions shown in Figure 6b,c, the spectrum of Figure 9a, and the EDS results in Table 4 present evidence that the main inclusions present in the metallic matrix were MnS and Al2O3. The presence of these defects provides the mismatch of the stiffness of the steel matrix and the inclusions, due to the differences between the elasticity modules [32]. For MnS inclusions, there is a stiffness with insufficient compatibility with that of the matrix (under-matching), and in this way a zone of concentration of tension develops in the inclusion, and when this is deformed, it can be flattened, generating the notch effect, and negatively affecting the ductility of the steel [32]. On the other hand, in Al2O3 inclusions, there is an excessive mismatch of its rigidity with that of the matrix (over-matching). When the material is submitted to external loads, the stresses are higher in the matrix material than in the inclusion, which generates residual tensions located around the inclusion, in addition to the nucleation of cracks in the matrix or in the matrix/inclusion interface [40,41,42,43]. Cracks that nucleate from inclusions may coalesce during the propagation process to form larger cracks [44]. Therefore, all these factors have a deleterious effect on the ductility of the shaft material and, consequently, for the reduction of its fatigue properties. This effect can be further amplified by size, because the greater the inclusions, the more affected the mechanical properties of the alloy [45,46,47,48,49]. Therefore, it is important to monitor and control the size, shape, and composition of non-metallic inclusions in the casting process to obtain clean steel.
The sample for the hardness test was extracted from the material of the fractured shaft to determine the hardness profile from the shaft surface as shown in Figure 12a. The average surface hardness was 47 HRC, which is high in comparison with the core, which was 22.5 HRC. These results were consistent with the microstructures observed for each region of analysis, confirming the hardening treatment execution. The core hardness was adequate, but an even greater hardness on the surface would be desirable since this confers increased resistance to fatigue and to crack nucleation.
The microhardness test was performed along a track of indentations at intervals of 500 µm in the hardened surface layer of the shaft, to assess the behavior near the phase boundary line, as shown in Figure 12b. The results of the graph show a sudden drop in the hardness at the 1500 µm position regarding the microstructure of polygonal and Windmanstätten banded ferrite before the phase boundary line. These results were consistent with the microstructures analyzed in the previous topic and indicated that the transition phase had a low resistance.
Therefore, according to Figure 12b, it is evident that during the service conditions of the shaft, there was a deformation mismatch between the high hardness microstructure at its surface (0 µm—Figure 12b) and the soft phases just beneath it. Similarly, it is also possible to state that there was a non-homogeneous deformation in the phase contour line (approximately at 2000 µm, Figure 12b), which separated the regions of the material with low hardness (left of the red line) and with high hardness (right of the red line). In view of the great difference in the hardness of the microstructures, there was a high possibility of crack growth occurring at their interfaces, due to the mechanism of decohesion of the structures [34,35,36,37]. In the present study, interface decohesion may have been caused by the more pronounced local deformation of the soft constituent, as reported in the literature [38,39].
4.6. Metallurgical Deffects
Zhang et al. [40] stated that common defects arising from steel production, such as non-metallic inclusions and pores, compete with the metallic matrix to be the starting point for fatigue cracks. The authors stated that the smaller the size of these defects, the less likely it is that cracks will start from them. In this sense, some studies pointed out that in the case of high-strength steels, the fatigue cracks will not originate in inclusions when their size is smaller than the critical inclusion size ϕc (µm) [9,50,51,52]. According to Murakami [51,53], the fatigue strength σI (MPa) of a non-metallic inclusion can be determined by Equation (2):
where HV (kgf/mm2) is the Vickers hardness of the metallic matrix, A represents the projected area of the inclusion perpendicular to the applied stress axis, and C* is a geometric location constant, which for inclusions located on the surface, subsurface, and internal region is equal to 1.43, 1.41, and 1.56, respectively. It is worth mentioning that Equation (2) effectively models the fatigue strength of steel inclusions with a hardness ranging from 70 to 720 HV, and with an error of ± 10% [54].
According to Zerbst et al. [11] and Garwood et al. [55] , for low and medium carbon steels (situation of this work, see Table 2), there is an empirical expression that establishes a linear relationship between hardness and resistance to fatigue:
where σM corresponds to the fatigue strength of the metal matrix of the axis. Additionally, Zhang et al. [56] stated that the fatigue strength of the inclusion (σW) is often less than that of the matrix microstructure (σM), until the size of the inclusion decreases to a critical value. Additionally, according to Yang et al. [52], assuming that σI = σM and taking into account that the inclusions have spherical morphology, the critical inclusion size ϕc (µm), can be deduced by Equations (2) and (3):
where the term C is a constant of 0.969, 0.813, and 0.528 for inclusions located inside the material, surface, and subsurface, respectively. In this work, the vast majority of the shaft inclusions were globular oxides (Figure 6b). In addition, the area analysis of the inclusions revealed that they had an average circularity close to the shape of spheres (circularity of 0.8). Therefore, Equation (4) can be applied to calculate the ϕc of the shaft steel.
For this calculation, it was taken into account that inside the shaft (between 500 µm and 1500 µm deep from the surface, Figure 12b) there was the formation of low hardness phases, such as quasi-polygonal ferrite and Widmanstätten ferrite. Thus, the medium hardness of this region (245 HV) was chosen. Therefore, according to Equation (4), the ϕc is about 11 µm.
As the average (19 µm) and maximum (66 µm) size of material inclusions were larger than the ϕc, this means that below the shaft surface there were many potential points for the nucleation of fatigue cracks. Therefore, with the growth of these first cracks in the subsurface of the shaft, the formation of the main fatigue crack occurred, and its propagation rate dictated the fatigue life of the component (Stage 2). Therefore, it is possible to attribute the trigger of the main fatigue crack to the non-metallic inclusions of the material. It is important to note that the ϕc calculated for the steel in this work is consistent with the values presented in other studies [52,57,58].
It should be noted that the other defects resulting from the manufacturing process of the shaft had a significant contribution to the reduction of the fatigue life. Figure 13 shows a grown crack between two pores, which were located at the phase contour. Chan [40] stated that fatigue strength and fatigue life are reduced in the presence of pores and when increasing their size. In addition, some studies have shown that fatigue cracks can also be initiated on or near pores [59,60]. Furthermore, Fan et al. [61] reported that relatively large pores, as well as less widely spaced pores, concentrate large plastic stresses that promote localized deformations which accelerate crack nucleation. Besides the presence of the pores, cracks at the phase contours may increase due to the formation of layers of microstructures with very distinct mechanical properties, caused by inadequate heat treatment [33,34,35,36]. Finally, fatigue failure was also strongly induced by the large number of inclusions spread along the surface region of the shaft being 42% above the ϕc. Once the crack had nucleated, the cyclic loading inherent during the working regime of the shaft led to the continuous growth of the crack until the complete collapse of the shaft.
5. Conclusions
This study analyzed the failure of the shaft of a speed reducer, and the analysis allowed us to conclude the following:
- The fractography revealed the presence of beach marks and crack nucleation on the fracture surface. The SEM analysis showed ratchet marks, secondary cracks, and fatigue striations. All this evidence confirmed that the shaft was fractured by fatigue.
- The shaft material was similar to the standard of chemical composition of AISI/SAE 4320 steel; however, the tensile tests revealed that the ductility, expressed by the elongation of 17.5%, was less than the range of variation of the specification (21–29).
- The material presented a huge number of inclusions present in the metallic matrix of the fracture surface. Specifically, the study found the length of the inclusions to be above the value of the critical inclusion size parameter, which indicates that the inclusions acted as nucleation points of cracks. The EDS analysis gave evidence that these inclusions were manganese sulfide (MnS) and aluminum oxide (Al2O3), and that they were responsible for the decrease in the ductility of the alloy.
- The hardened surface was not uniform and thick enough along the section of the shaft, presenting a thin layer of bainite followed by a low resistance ferrite banded structure up to the phase boundary line, indicating an inadequate heat treatment. In view of the great difference in the hardness of the microstructures, a high possibility of crack growth occurred at their interfaces.
6. Recommendations
In order to prevent the reported type of failure, the level of cleanliness of the steel is very important. A good practice would be to follow the specifications of the ASTM E45-13 standard [15], trying to reduce the size of the non-metallic inclusions to values below the critical size. Another important factor is the design/execution of the heat treatment to harden the material. A heat treatment based on the TTT diagram of the alloy must be strictly followed, as well as the use of appropriate equipment and instrumentation for monitoring and controlling the component’s heating and/or cooling operations. Finally, a more frequent maintenance plan for speed reduction boxes is recommended, in addition to monitoring the growth of cracks, with inspections using non-destructive tests.
Author Contributions
Conceptualization, R.S.M. and A.P.A.C.; methodology, R.S.M. and A.P.A.C.; investigation, R.S.M., C.C., A.P.A.C.; writing—original draft preparation, R.S.M.; writing—review and editing, C.C., N.C. and A.P.A.C.; supervision, N.C. and A.P.A.C.; funding acquisition, A.P.A.C. All authors have read and agreed to the published version of the manuscript.
Funding
This project was supported by the FAPEMA (Fundação de Amparo à Pesquisa e ao Desenvolvimento Científico e Tecnológico do Maranhão), grant number (02124/14), State of Maranhão-Brazil.
Institutional Review Board Statement
Not applicable.
Informed Consent Statement
Not applicable.
Data Availability Statement
Not applicable.
Acknowledgments
The authors thank Espaço da Escrita–Pró-Reitoria de Pesquisa–UNICAMP–for the language services provided and FAPEMA (Foundation for Research and Scientific and Technological Development of Maranhão) for the research support.
Conflicts of Interest
The authors declare no conflict of interest.
References
- Kim, E.S.; Choi, S.K. Failure analysis of connecting bolts in collapsed tower crane. Fatigue Fract. Eng. Mater. Struct. 2013, 36, 228–241. [Google Scholar] [CrossRef]
- Brown, S. Forensic engineering: Reduction of risk and improving technology (for all things great and small). Eng. Fail. Anal. 2007, 14, 1019–1037. [Google Scholar] [CrossRef]
- Powell, G.W.; Mahmoud, S.E. Failure Analysis and Prevention. In Metals Handbook, 9th ed.; American Society for Metals: Geauga County, OH, USA, 1986; Volume 11. [Google Scholar]
- McDonnell Douglas, A.C. SEM/TEM Fractography Handbook; Metals and Ceramics Information Center: Columbus, OH, USA, 1975. [Google Scholar]
- Banuta, M.; Tarquini, I. Fatigue Failure of a Drive Shaft. J. Fail. Anal. Prev. 2012, 12, 139–144. [Google Scholar] [CrossRef]
- Göksenli, A.; Eryurek, I. Failure analysis of an elevator drive shaft. Eng. Fail. Anal. 2009, 16, 1011–1019. [Google Scholar] [CrossRef]
- Bi, T.-T.; Yang, Z.-G. Failure analysis on speed reducer shaft of sluice gate in nuclear power plant. Eng. Fail. Anal. 2017, 80, 453–463. [Google Scholar] [CrossRef]
- Zambrano, O.; Coronado, J.; Rodriguez, S. Failure analysis of a bridge crane shaft. Case Stud. Eng. Fail. Anal. 2014, 2, 25–32. [Google Scholar] [CrossRef] [Green Version]
- Zerbst, U.; Madia, M.; Klinger, C.; Bettge, D.; Murakami, Y. Defects as a root cause of fatigue failure of metallic components. I: Basic aspects. Eng. Fail. Anal. 2019, 97, 777–792. [Google Scholar] [CrossRef]
- Das, S.; Mukhopadhyay, G.; Bhattacharyya, S. Failure analysis of axle shaft of a fork lift. Case Stud. Eng. Fail. Anal. 2015, 3, 46–51. [Google Scholar] [CrossRef] [Green Version]
- Zerbst, U.; Madia, M.; Klinger, C.; Bettge, D.; Murakami, Y. Defects as a root cause of fatigue failure of metallic components. II: Non-metallic inclusions. Eng. Fail. Anal. 2019, 98, 228–239. [Google Scholar] [CrossRef]
- Du, J.; Liang, J.; Zhang, L. Research on the failure of the induced draft fan’s shaft in a power boiler. Case Stud. Eng. Fail. Anal. 2016, 5, 51–58. [Google Scholar] [CrossRef] [Green Version]
- Brown, T. Torsional fatigue failures: Identification diagnosis and prevention. Uptime Maint. Reliab. Asset Manag. Prof. 2014, 20, 20–23. [Google Scholar]
- Voort, G.F.V. Macroscopic Examination Procedures for Failure Analysis. In Metallography in Failure Analysis; Springer: New York, NY, USA, 1978; pp. 33–63. [Google Scholar] [CrossRef]
- ASTM International. E45-18a Standard Test Methods for Determining the Inclusion Content of Steel; ASTM Internacional: West Conshohocken, PA, USA, 2018. [Google Scholar] [CrossRef]
- ASTM International. E8/E8M-21 Standard Test Methods for Tension Testing of Metallic Materials; ASTM Internacional: West Conshohocken, PA, USA, 2021. [Google Scholar] [CrossRef]
- Anderson, T.L. Fracture Mechanics: Fundamentals and Applications; CRC Press: Boca Raton, FL, USA, 2017; p. 706. [Google Scholar] [CrossRef]
- Schneider, C.A.; Rasband, W.S.; Eliceiri, K.W. NIH Image to ImageJ: 25 years of image analysis. Nat. Methods 2012, 9, 671–675. [Google Scholar] [CrossRef] [PubMed]
- Pantazopoulos, G.; Vazdirvanidis, A.; Rikos, A.; I Toulfatzis, A. Analysis of abnormal fatigue failure of forklift forks. Case Stud. Eng. Fail. Anal. 2014, 2, 9–14. [Google Scholar] [CrossRef] [Green Version]
- Casanova, F.; Mantilla, C. Fatigue failure of the bolts connecting a Francis turbine with the shaft. Eng. Fail. Anal. 2018, 90, 1–13. [Google Scholar] [CrossRef]
- Dalvi, S.D.; Chandrababu, D.; Satav, S. Failure analysis of a carbon steel roller shaft of continuous pad steam machine. Case Stud. Eng. Fail. Anal. 2017, 9, 118–128. [Google Scholar] [CrossRef]
- Davis, J.R. Metals Handbook Desk Edition, 2nd ed.; ASM International: Novelty, OH, USA, 1998. [Google Scholar]
- Sachs, N.W. Understanding the surface features of fatigue fractures: How they describe the failure cause and the failure history. J. Fail. Anal. Prev. 2005, 5, 11–15. [Google Scholar] [CrossRef]
- Varin, J.D. Fracture characteristics of steering gear sector shafts. Pract. Fail. Anal. 2002, 2, 65–69. [Google Scholar] [CrossRef]
- Harun, M.F.; Mohammad, R.; Kotousov, A. Low Cycle Fatigue Behavior of Elbows with Local Wall Thinning. Metals 2020, 10, 260. [Google Scholar] [CrossRef] [Green Version]
- Cazin, D.; Braut, S.; Božić, Z.; Žigulić, R. Low cycle fatigue life prediction of the demining tiller tool. Eng. Fail. Anal. 2020, 111, 104457. [Google Scholar] [CrossRef]
- Odanovic, Z.; Ristivojevic, M.; Milosevic-Mitic, V. Investigation into the causes of fracture in railway freight car axle. Eng. Fail. Anal. 2015, 55, 169–181. [Google Scholar] [CrossRef]
- Atkinson, H.; Shi, G. Characterization of inclusions in clean steels: A review including the statistics of extremes methods. Prog. Mater. Sci. 2003, 48, 457–520. [Google Scholar] [CrossRef]
- Kovačič, M.; Senčič, S. Critical inclusion size in spring steel and genetic programming. RMZ Mater. Geoenviron. 2010, 57, 17–23. [Google Scholar]
- Kiessling, R. Nonmetallic inclusions and their effects on the properties of ferrous alloys. In Encyclopedia of Materials: Science and Technology; Elsevier: Oxford, UK, 2001; pp. 6278–6283. [Google Scholar]
- Juvonen, P. Effects of Non-Metallic Inclusions on Fatigue Properties of Calcium Treated Steels; Helsinki University of Technology: Espoo, Finland, 2004. [Google Scholar]
- Zerbst, U.; Klinger, C. Material defects as cause for the fatigue failure of metallic components. Int. J. Fatigue 2019, 127, 312–323. [Google Scholar] [CrossRef]
- Han, Q.; Asgari, A.; Hodgson, P.D.; Stanford, N. Strain partitioning in dual-phase steels containing tempered martensite. Mater. Sci. Eng. A 2014, 611, 90–99. [Google Scholar] [CrossRef]
- Zhao, P.; Gao, G.; Misra, R.; Bai, B. Effect of microstructure on the very high cycle fatigue behavior of a bainite/martensite multiphase steel. Mater. Sci. Eng. A 2015, 630, 1–7. [Google Scholar] [CrossRef]
- Steinbrunner, D.L.; Matlock, D.K.; Krauss, G. Void formation during tensile testing of dual phase steels. Met. Mater. Trans. A 1988, 19, 579–589. [Google Scholar] [CrossRef]
- Zhang, G.-Z.; Liu, C.-P.; Ren, R.-M.; Wu, S.; Yin, H.-X.; Cong, T.; Li, X. Effect of nonuniform microstructure on wear property of ER8 wheel steel. Wear 2020, 458–459, 203416. [Google Scholar] [CrossRef]
- Gao, B.; Tan, Z.; Liu, Z.; Gao, G.; Zhang, M.; Zhang, G.; Bai, B. Influence of non-uniform microstructure on rolling contact fatigue behavior of high-speed wheel steels. Eng. Fail. Anal. 2019, 100, 485–491. [Google Scholar] [CrossRef]
- Dakshinamurthy, M.; Ma, A. Crack propagation in TRIP assisted steels modeled by crystal plasticity and cohesive zone method. Theor. Appl. Fract. Mech. 2018, 96, 545–555. [Google Scholar] [CrossRef] [Green Version]
- Shen, Y.; Qiu, L.; Sun, X.; Zuo, L.; Liaw, P.; Raabe, D. Effects of retained austenite volume fraction, morphology, and carbon content on strength and ductility of nanostructured TRIP-assisted steels. Mater. Sci. Eng. A 2015, 636, 551–564. [Google Scholar] [CrossRef] [Green Version]
- Chan, K.S. Roles of microstructure in fatigue crack initiation. Int. J. Fatigue 2010, 32, 1428–1447. [Google Scholar] [CrossRef]
- Puff, R.; Barbieri, R. Effect of non-metallic inclusions on the fatigue strength of helical spring wire. Eng. Fail. Anal. 2014, 44, 441–454. [Google Scholar] [CrossRef]
- Pineau, A.; Antolovich, S.D. Probabilistic approaches to fatigue with special emphasis on initiation from inclusions. Int. J. Fatigue 2016, 93, 422–434. [Google Scholar] [CrossRef]
- Yu, H.-L.; Liu, X.-H.; Bi, H.-Y.; Chen, L.-Q. Deformation behavior of inclusions in stainless steel strips during multi-pass cold rolling. J. Mater. Process. Technol. 2009, 209, 455–461. [Google Scholar] [CrossRef]
- Jha, A.K.; Sreekumar, K. Failure Analysis of Stainless Steel Stem Used in Explosive Transfer Assembly (ETA) of High Performance Solid Propulsion System Igniter. J. Fail. Anal. Prev. 2009, 10, 77–81. [Google Scholar] [CrossRef]
- Zhu, S.; Foletti, S.; Beretta, S. Evaluation of Size Effect in Low Cycle Fatigue for Q & T Rotor Steel. Procedia Struct. Integr. 2017, 7, 368–375. [Google Scholar] [CrossRef]
- Hernández, F.R.; Cummings, S.; Kalay, S.; Stone, D. Properties and microstructure of high performance wheels. Wear 2011, 271, 374–381. [Google Scholar] [CrossRef]
- Alfredsson, B.; Olsson, E. Multi-axial fatigue initiation at inclusions and subsequent crack growth in a bainitic high strength roller bearing steel at uniaxial experiments. Int. J. Fatigue 2012, 41, 130–139. [Google Scholar] [CrossRef]
- Mikkola, E.; Marquis, G.; Solin, J. Mesoscale modelling of crack nucleation from defects in steel. Int. J. Fatigue 2012, 41, 64–71. [Google Scholar] [CrossRef]
- Ma, J.; Zhang, B.; Xu, D.; Han, E.-H.; Ke, W. Effects of inclusion and loading direction on the fatigue behavior of hot rolled low carbon steel. Int. J. Fatigue 2010, 32, 1116–1125. [Google Scholar] [CrossRef]
- Yang, Z.; Yao, G.; Li, G.; Li, S.; Chu, Z.; Hui, W.; Dong, H.; Weng, Y. The effect of inclusions on the fatigue behavior of fine-grained high strength 42CrMoVNb steel. Int. J. Fatigue 2004, 26, 959–966. [Google Scholar] [CrossRef]
- Murakami, Y.; Endo, M. Effects of defects, inclusions and inhomogeneities on fatigue strength. Int. J. Fatigue 1994, 16, 163–182. [Google Scholar] [CrossRef]
- Yang, Z.; Zhang, J.; Li, S.; Li, G.; Wang, Q.; Hui, W.; Weng, Y. On the critical inclusion size of high strength steels under ultra-high cycle fatigue. Mater. Sci. Eng. A 2006, 427, 167–174. [Google Scholar] [CrossRef]
- Murakami, Y.; Kodama, S.; Konuma, S. Quantitative evaluation of effects of non-metallic inclusions on fatigue strength of high strength steels. I: Basic fatigue mechanism and evaluation of correlation between the fatigue fracture stress and the size and location of non-metallic inclusions. Int. J. Fatigue 1989, 11, 291–298. [Google Scholar] [CrossRef]
- Murakami, Y. Metal Fatigue: Effects of Small Defects and Nonmetallic Inclusions; Elsevier: Amsterdam, The Netherlands, 2019; p. 758. [Google Scholar] [CrossRef]
- Garwood, M.F.; Zurburg, H.H. Correlation of laboratory tests and service performance. In Interpretation of Tests and Correlation with Service; American Society for Metals: Geauga County, OH, USA, 1951; pp. 1–77. [Google Scholar]
- Zhang, J.; Li, S.; Yang, Z.; Li, G.; Hui, W.; Weng, Y. Influence of inclusion size on fatigue behavior of high strength steels in the gigacycle fatigue regime. Int. J. Fatigue 2007, 29, 765–771. [Google Scholar] [CrossRef]
- Farahat, A.I.Z.; Hamid, Z.A.; Gomaa, N. Failure Analysis of Train Vehicles Engagement Arm. J. Fail. Anal. Prev. 2015, 15, 576–582. [Google Scholar] [CrossRef]
- Baldizzone, C.; Gruttadauria, A.; Mapelli, C.; Mombelli, D. Investigation of Failure in a Crankpin of a Motorcycle Engine. J. Fail. Anal. Prev. 2012, 12, 123–129. [Google Scholar] [CrossRef]
- Zhu, X.; Jones, J.; Allison, J. Effect of Frequency, Environment, and Temperature on Fatigue Behavior of E319 Cast Aluminum Alloy: Stress-Controlled Fatigue Life Response. Met. Mater. Trans. A 2008, 39, 2681–2688. [Google Scholar] [CrossRef]
- Lados, D.A.; Apelian, D.; De Figueredo, A.M. Fatigue performance of high integrity cast aluminum components. In Proceedings of the 2nd International Aluminum Casting Technology Symposium, Columbus, OH, USA, 7–9 October 2002; pp. 5–25. [Google Scholar]
- Fan, J.; McDowell, D.L.; Horstemeyer, M.; Gall, K. Cyclic plasticity at pores and inclusions in cast Al–Si alloys. Eng. Fract. Mech. 2003, 70, 1281–1302. [Google Scholar] [CrossRef]
Figure 1.
(a) Reduction box system, indicating the analyzed shaft; (b) dimensions in millimeters of the fractured output shaft and location of the fracture plane.
Figure 1.
(a) Reduction box system, indicating the analyzed shaft; (b) dimensions in millimeters of the fractured output shaft and location of the fracture plane.

Figure 2.
Fractured shaft of the speed reducer.

Figure 3.
Fractured reducer shaft: (a) Side view showing the plastic deformation (red arrow) of the material under the fracture surface, (b) top view (fracture surface before cleaning), (c) fracture surface slope, (d) samples for the characterization and analysis withdrawn from the shaft. Green arrows indicate crack nucleation area.

Figure 4.
(a) Fracture surface after cleaning procedures; (b) zone of fatigue (region B) and the final failure area due to overload (A and C regions), red arrow indicates the final fracture zone; (c) fracture surface details of the reducer shaft.
Figure 4.
(a) Fracture surface after cleaning procedures; (b) zone of fatigue (region B) and the final failure area due to overload (A and C regions), red arrow indicates the final fracture zone; (c) fracture surface details of the reducer shaft.

Figure 5.
Fracture micromechanism: (a) Ratchet and microcracks brands; (b) fatigue propagation and striations; (c) detail of (b); (d) secondary crack found in zone C; (e) region of quasi-cleavage fracture containing traces of a fragile fracture by cleavage and dimples; (f–h) are details of (e).
Figure 5.
Fracture micromechanism: (a) Ratchet and microcracks brands; (b) fatigue propagation and striations; (c) detail of (b); (d) secondary crack found in zone C; (e) region of quasi-cleavage fracture containing traces of a fragile fracture by cleavage and dimples; (f–h) are details of (e).

Figure 6.
(a) Non-uniform hardened cross-section shaft layer. Red arrows indicate the hardened layer with a width less than 2 mm; (b) inclusions present in the shaft; (c) frequency distribution of the inclusions areas at the subsurface of the shaft.
Figure 6.
(a) Non-uniform hardened cross-section shaft layer. Red arrows indicate the hardened layer with a width less than 2 mm; (b) inclusions present in the shaft; (c) frequency distribution of the inclusions areas at the subsurface of the shaft.

Figure 7.
(a) Optical micrograph of the transversal section showing the microstructural change from the surface to the shaft core. Yellow arrows indicate the localization tracks of polygonal ferrite nucleated with a small amount of perlite; (b) detail of (a); (c) polygonal ferrite and pearlite nucleated in the area of the banded structure.

Figure 8.
(a) Distribution of the upper bainite layer showing elongated grains; (b) detailing of the grain distortion in the first 100 µm; (c) distribution of the upper bainite in the boundaries of the old austenitic grain; (d) detail of (a); (e) banded structure; (f,g) detail of (e) showing the distribution of inclusions in the matrix; (h) detail showing the matrix; (g) large magnification of the matrix. The yellow arrows indicate inclusions distributed in the matrix.

Figure 9.
EDS analysis of inclusion present in the banded structure for region 2: (a) spectrum 1 corresponds to the analysis results shown in (c); (b) spectrum 2 corresponds to the analysis results shown in (d).
Figure 9.
EDS analysis of inclusion present in the banded structure for region 2: (a) spectrum 1 corresponds to the analysis results shown in (c); (b) spectrum 2 corresponds to the analysis results shown in (d).

Figure 10.
(a) Phase transition of the banded structure; (b) martensite with some colonies of upper bainite; (c) martensite microstructure; (d) detail of (b).
Figure 10.
(a) Phase transition of the banded structure; (b) martensite with some colonies of upper bainite; (c) martensite microstructure; (d) detail of (b).

Figure 11.
(a) Martensite; (b) enlarged detail of (a); (c) acicular ferrite and pearlite in the shaft core; (d) enlarged detail of (c).
Figure 11.
(a) Martensite; (b) enlarged detail of (a); (c) acicular ferrite and pearlite in the shaft core; (d) enlarged detail of (c).

Figure 12.
(a) Hardness profile of the shaft cross-section; (b) distribution of the microhardness along the hardened surface layer of the shaft.
Figure 12.
(a) Hardness profile of the shaft cross-section; (b) distribution of the microhardness along the hardened surface layer of the shaft.

Figure 13.
Crack propagation between two pores along the boundary line of low hardness phases.


Table 1.
Operational parameters of the speed reducer.
| Shaft Diameter (mm) Input/Output | Transmission Ratio | Speed (RPM) Input/Output | Power (HP) Reducer/Required |
|---|---|---|---|
| 50.8/101.6 | 16 | 1170/73.1 | 119/94 |
Table 2.
Analysis of the shaft failure.
| Element | Surface, (%) (Hardening Surface) | Core, (%) | Specification AISI/SAE 4320 [22] |
|---|---|---|---|
| C | 0.19 | 0.19 | 0.17–0.22 |
| Si | 0.23 | 0.23 | 0.15–0.30 |
| Mn | 0.55 | 0.55 | 0.45–0.65 |
| P | 0.009 | 0.009 | 0.030 Max |
| S | 0.004 | 0.006 | 0.040 Max |
| Cr | 0.5 | 0.5 | 0.40–0.60 |
| Mo | 0.22 | 0.22 | 0.20–0.30 |
| Ni | 1.77 | 1.78 | 1.65–2.00 |
| Cu | 0.077 | 0.077 | 0.35 Max |
| Al | 0.006 | 0.006 | |
| Fe | Balance | Balance | Balance |
Table 3.
Classification and severity of inclusions.
| A (Sulfide) | B (Alumina) | C (Silicate) | D (Globular Oxide) | ||||
|---|---|---|---|---|---|---|---|
| Thin series | Heavy series | Thin series | Heavy series | Thin series | Heavy series | Thin series | Heavy series |
| 0 | 0 | 0.5 | 0.5 | 0 | 0 | 3.0 | 3.0 |
Table 4.
EDS results (weight (%)).
| Spectrum | Mn | Si | S | Cr | Ni | C | O | Ti | Al | Fe |
|---|---|---|---|---|---|---|---|---|---|---|
| 1 | 27.32 | 20.45 | 1.31 | 0.24 | 0.32 | 0.53 | 1.50 | 3.30 | 45.04 | |
| 2 | 1.13 | 0.77 | 0.21 | 0.45 | 7.16 | 90.27 |
Table 5.
Tensile test results.
| Heading | Yield Strength (MPa) | Ultimate Tensile Strength (MPa) | Elongation (%) | Reduction of Area (%) |
|---|---|---|---|---|
| Shaft steel | 591.3 ± 24.47 | 747.3 ± 9.11 | 17.5 ± 1.64 | 56.4 ± 1.36 |
| AISI/SAE 4320 [22] | 430–460 | 570–790 | 21–29 | Min 51 |
Publisher’s Note: MDPI stays neutral with regard to jurisdictional claims in published maps and institutional affiliations. |
© 2021 by the authors. Licensee MDPI, Basel, Switzerland. This article is an open access article distributed under the terms and conditions of the Creative Commons Attribution (CC BY) license (https://creativecommons.org/licenses/by/4.0/).
Share and Cite
MDPI and ACS Style
Miranda, R.S.; Cruz, C.; Cheung, N.; Cunha, A.P.A. Fatigue Failure Analysis of a Speed Reduction Shaft. Metals 2021, 11, 856. https://doi.org/10.3390/met11060856
AMA Style
Miranda RS, Cruz C, Cheung N, Cunha APA. Fatigue Failure Analysis of a Speed Reduction Shaft. Metals. 2021; 11(6):856. https://doi.org/10.3390/met11060856
Chicago/Turabian StyleMiranda, Rodrigo S., Clarissa Cruz, Noé Cheung, and Adilto P. A. Cunha. 2021. "Fatigue Failure Analysis of a Speed Reduction Shaft" Metals 11, no. 6: 856. https://doi.org/10.3390/met11060856
Note that from the first issue of 2016, this journal uses article numbers instead of page numbers. See further details here.