Fourier Series for Square Wave.pdf
Fourier Series for Square Wave.pdf
Fourier Series for Square Wave.pdf

Create successful ePaper yourself
Turn your PDF publications into a flip-book with our unique Google optimized e-Paper software.
ME 201/MTH 281/ME400/CHE400<br />
<strong>Fourier</strong> <strong>Series</strong> <strong>for</strong> a <strong>Square</strong> <strong>Wave</strong><br />
1. Introduction<br />
In this notebook we look at the numerical convergence of the <strong>Fourier</strong> series <strong>for</strong> a square wave. Later we will also take a<br />
graphical look at the convergence. The notebook is written so that it easily can be modified to study the convergence of the<br />
<strong>Fourier</strong> series of a different function. The specific function used is defined in section 2.<br />
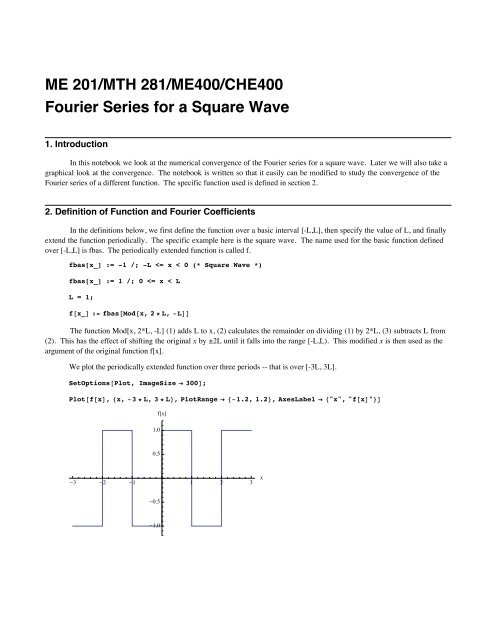
2. Definition of Function and <strong>Fourier</strong> Coefficients<br />
In the definitions below, we first define the function over a basic interval [-L,L], then specify the value of L, and finally<br />
extend the function periodically. The specific example here is the square wave. The name used <strong>for</strong> the basic function defined<br />
over [-L,L] is fbas. The periodically extended function is called f.<br />
fbas[x_] := -1 /; -L
2 sqwv.nb<br />
Strictly speaking the vertical lines shown on the graph at the discontinuity are not part of the graph. In some ways they<br />
make it easier to visualize the discontinuous function, but on those days when we are feeling fussy, we can exclude those<br />
segments. This is done by an Option <strong>for</strong> plot called Exclusions. The plot without the vertical lines is constructed below. The<br />
argument of the Option Exclusions is a list of points to be excluded.<br />
Plot@f@xD, 8x, -3 * L, 3 * L
TableForm@Table@foursum@i * 0.05, 10 * 2^j - 1D, 8i, 1, 10