


1. Introduction
The high-voltage (HV) power system is made up of a combination of generators, transmission lines, and distribution systems that utilizes underground and overhead conductors to deliver power to consumers. The successful selection of the insulation system for certain voltage levels and applications is critical to the performance and operation of HV components within the infrastructure.1,2 The life-span of the HV apparatus is determined by the condition of the insulation systems at the time of commissioning and as they age. Regular insulation inspections and proper maintenance cultures are essential for any power plant’s long-term viability.3–6 In particular, reference5 shows how the lack of adequate maintenance of HV equipment can affect their long-term performance. Recently, one of the most widely used methods for identifying insulation faults in HV plants has been the evaluation and examination of partial discharges (PD).7,8
HV power apparatus can suffer from electrical discharges, known as PDs.1,9,10 These discharges are a sign of fault within or outside the insulation. (e.g. surface discharges or corona). Electrical or thermal effects, among other things, can cause them to occur regardless of the source that caused the fault. PDs are the most common cause of electrical insulation material deterioration and can result in the failure of a HV plant, posing a serious health and safety risk. If PD faults are not detected early enough, they can lead to catastrophic and expensive failures of equipment. Deterioration of insulation due to PD can be caused by a wide range of different factors. They consist of a cavity in the insulation, electrodes with sharp edges, floating points and partially dried insulation.11,12 There are five distinct types of PDs: external, internal, floating, electrical trees and contact noise. Among them, internal discharge is one of the most important as it commonly occurs in the insulation systems of underground cables and high voltage transformers. It occurs in the form of cavities of various shapes and sizes, which are caused by high electric field stress across the cavities.
It is critical to track the progression of discharge in a cavity in order to determine the changes in the uniqueness of different PD patterns.13,14 Cavity discharges exhibit an unpredictable behaviour. In some cases, the number of discharges and their amplitude in a cavity can increase, decrease, or even disappear.15 The breakdown voltage in cavities, however, is determined by the dimensions, gaseous substances, pressure and temperature in the cavity, according to Paschen’s law.16 Due to the polymer’s chemical reaction, discharges within the surface of the cavity deposit conducting layers around the periphery of the cavity. If there are changes in the boundary conditions, some charge carriers may be stuck on the surface. This could change the way the PD mechanism works. Streamer discharges predominate in a cavity for the first hour of stressing, then transform to Townsend discharges due to the change in surface resistivity caused by sustained charge carriers.17
PD activity within cavities in insulation systems has been studied by a number of researchers.7,18–20 Most of the aforementioned research studied PD in either cross-linked polyethylene and epoxy resin insulation but few have studied cavities in poly-ethylene-terephthalate (PET).21
Some authors have studied and evaluated the effect of PD distribution patterns of single, serial, and parallel cavity characteristics in PET.22 PD measurements from artificially created PET cavities of single, parallel, and serial geometry have recently been analyzed, and PD patterns established.23
The primary objective of this study is to present experimental results on the discharge progression of single cavities (of various sizes), electrode-bounded cavity, parallel cavities and serial cavities in PET over a lengthy stressing time i.e. when the insulation material begins to deteriorate. Analysis of PD patterns over different cavity dimensions and arrangements is carried out to determine the phase-amplitude-number (φ-q-n) variations and their relevance to HV apparatus degradation
2. Methodology
2.1. Experimental set-up
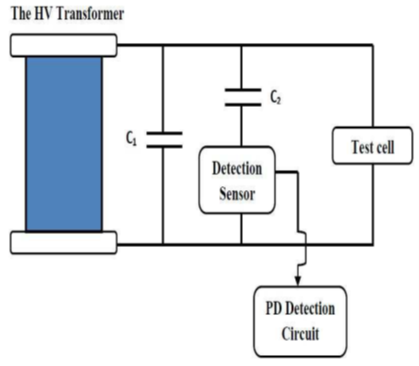
The IEC 60270 PD standard is followed during the PD measurement process (2001).24 The HV AC test system comprises the HV transformer, a PD measurement capacitor (C2), an AC measurement capacitor (C1), current/voltage regulating devices, over- voltage protection, experimental test cell and the PD detection circuit. The test cell comprises of the artificially created PD fault. A schematic diagram is shown in Figure 1. All experiments in this study are conducted at a power frequency of 50Hz.

This study will examine four distinct types of PD fault: Single cavities (0.6mm and 1mm in diameter), two multiple cavities (serial and parallel), and an electrode-bounded cavity.
2.1.1. Single cavity
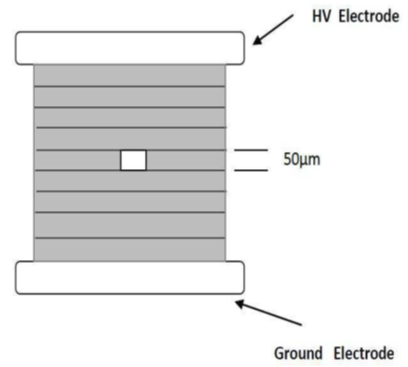
A set of PET samples with a cylindrical cavity were used to conduct experiments on a single cavity. First, measurements were taken on three 0.6mm diameter cavity samples and three 1mm diameter cavity samples that were manufactured separately. For each experiment, nine PET layers are created, with the cavity in the middle of the PET layer (see Figure 2). The inception voltages for the PD in the 0.6mm and 1mm diameter cavity are 2.82kV and 3.4kV respectively. For each experiment, data were recorded at 30% above the inception voltage, and over 50 and 250 power cycles

2.1.2. Multiple cavities
HV insulation may have multiple cavities. These cavities can be located in various locations with the insulating material. Thus, it is critical to examine the PD patterns emanating from these schemes and compare them to those emanating from a single cavity to determine whether there are variations in PD patterns over a longer degradation period. The serial and parallel cavity experimental setups are similar to the single void configuration, with the exception that the cavity positions in the PET insulation and the inception voltage vary due to changes in the electric field within the cavity arrangement (Figure 3). For parallel and serial cavity configurations, the PD inception voltage (PDIV) is around 3.2kV and 2.7kV, respectively.

2.1.3. Electrode bounded cavity
The discharges from an electrode-bounded cavity are investigated by creating a cavity of 10mm diameter size close to the HV electrode on the PET topmost layer. This is to ensure that one side of the cavity has a PET surface and the other side has an electrode surface. Nine PET sheets are used, similar to the single cavity experiments (see Figure 4). A voltage of 3.6kV is used in all of the experiments, and φ-q-n patterns are captured every 15 minutes over a 7hr time frame.

2.2. Experimental procedure and data capture procedure
Experiments were carried out in the HV laboratory. The power tracker system recorded and monitored the PD. It provides fundamental capabilities such as data capture control, calibration settings, data channel selection, file saving paths, and basic function display controls, as well as advanced capabilities. Different controls for altering phase and amplitude bin resolutions, the number of captured power cycles, and amplitude/voltage threshold levels are available on the power tracker, which can produce real-time, power cycle-synchronized φ-q-n patterns. It also can log data patterns at predetermined intervals. This is critical for the present study, as some experiments necessitate long periods of HV stressing, and data must be stored and captured systematically over such periods.
Unlike previous PD detection techniques, the power tracker not only monitors but also analyses the parameters related to the PD (e.g. apparent charge and transient current).
2.3. Calibration
All of the experiments in this study used a PD injector calibration pulse with varying amplitudes ranging from 500-1000pC. When the HV system is not energized, a known PD pulse is used and injected into it to calibrate the PD, and the amplitude level in mV is monitored. The injected pulse in pC corresponds to the peak amplitude value of the PD, which is used to calculate the calibration factor for the experiments.
3. Results and Discussion
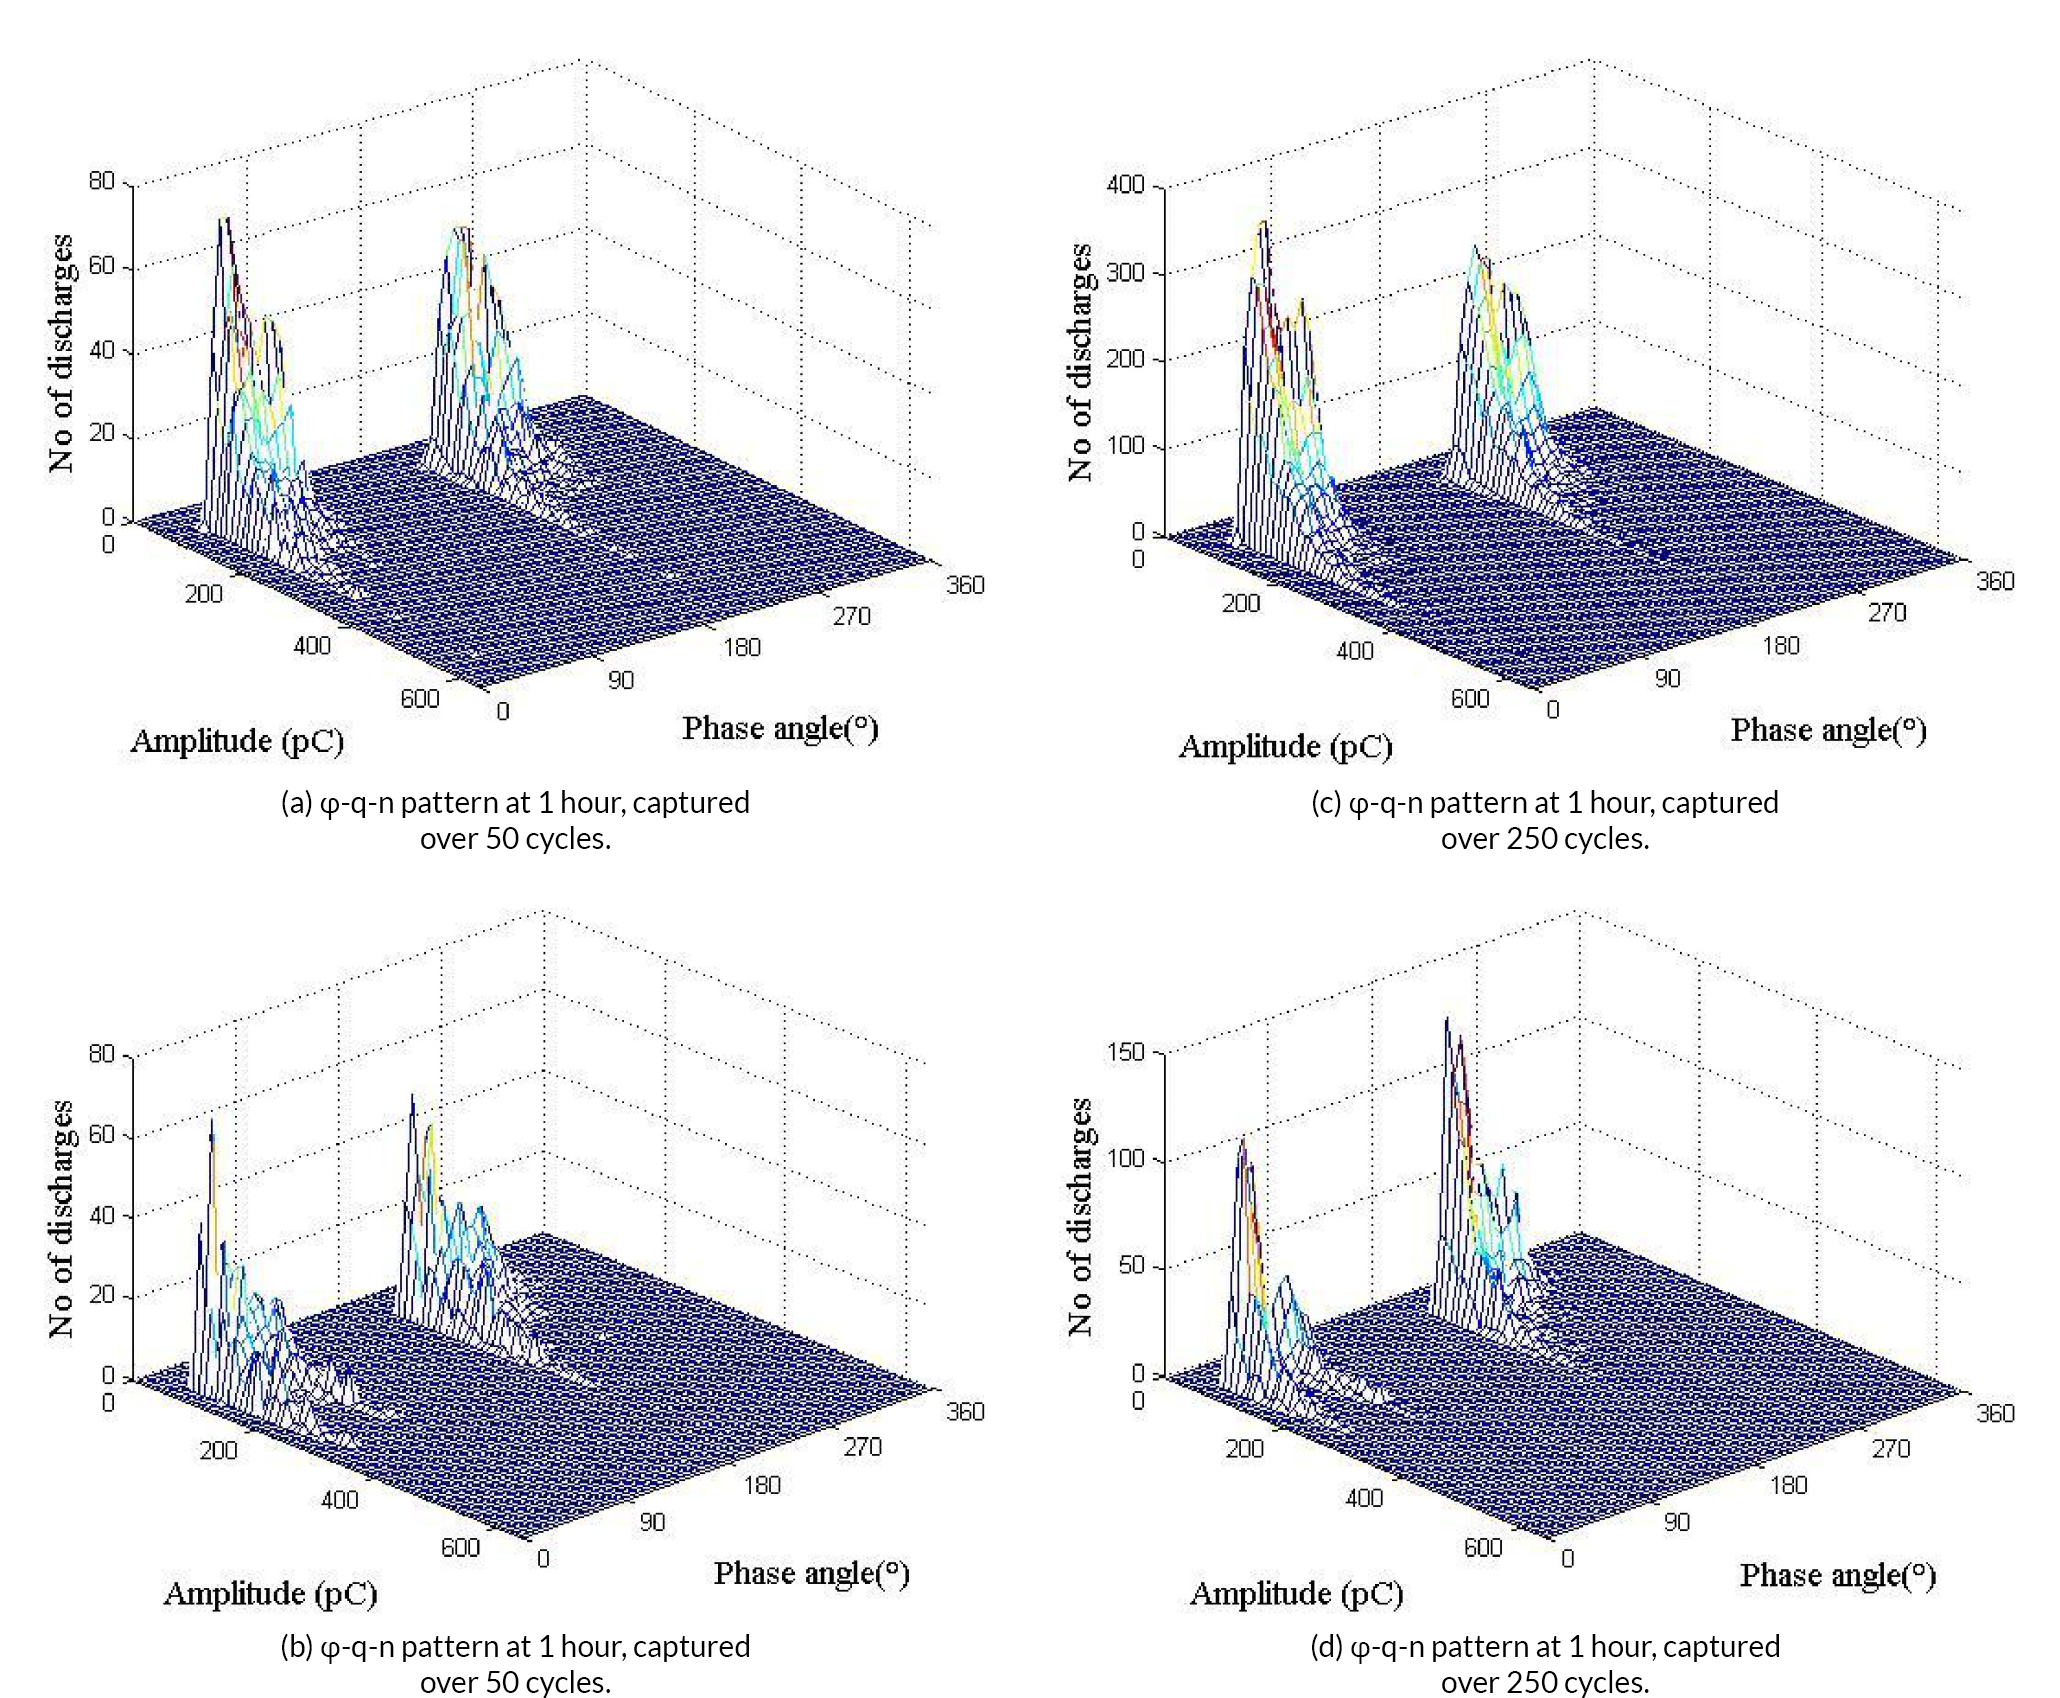
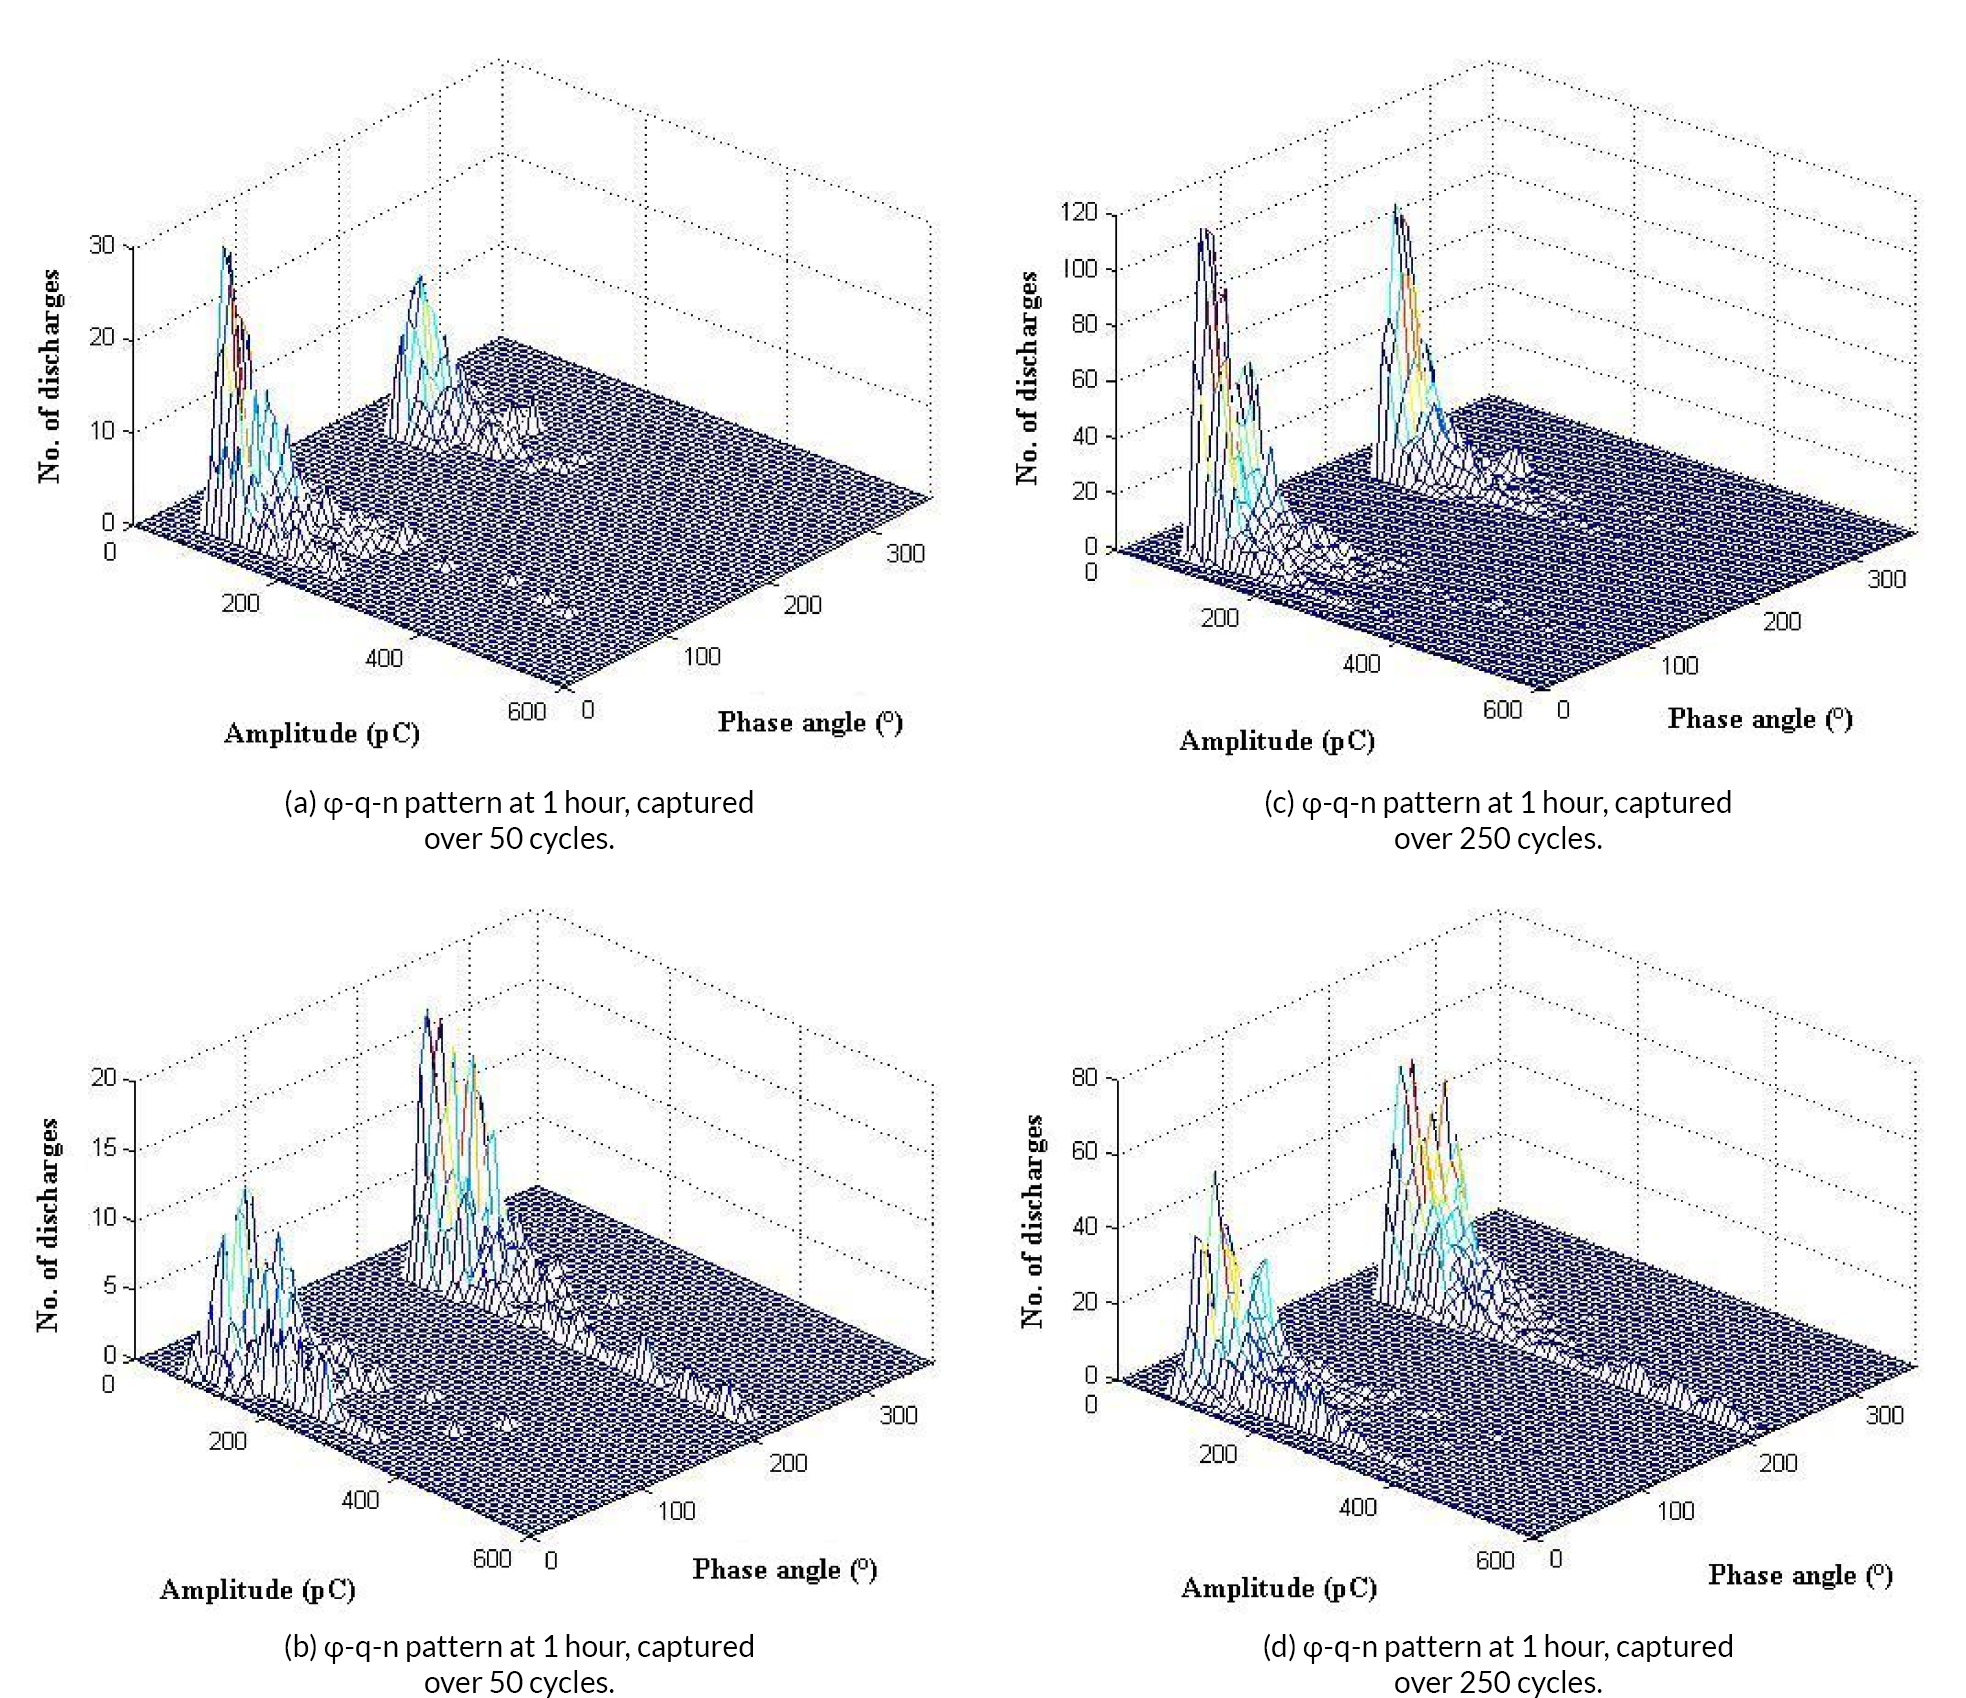
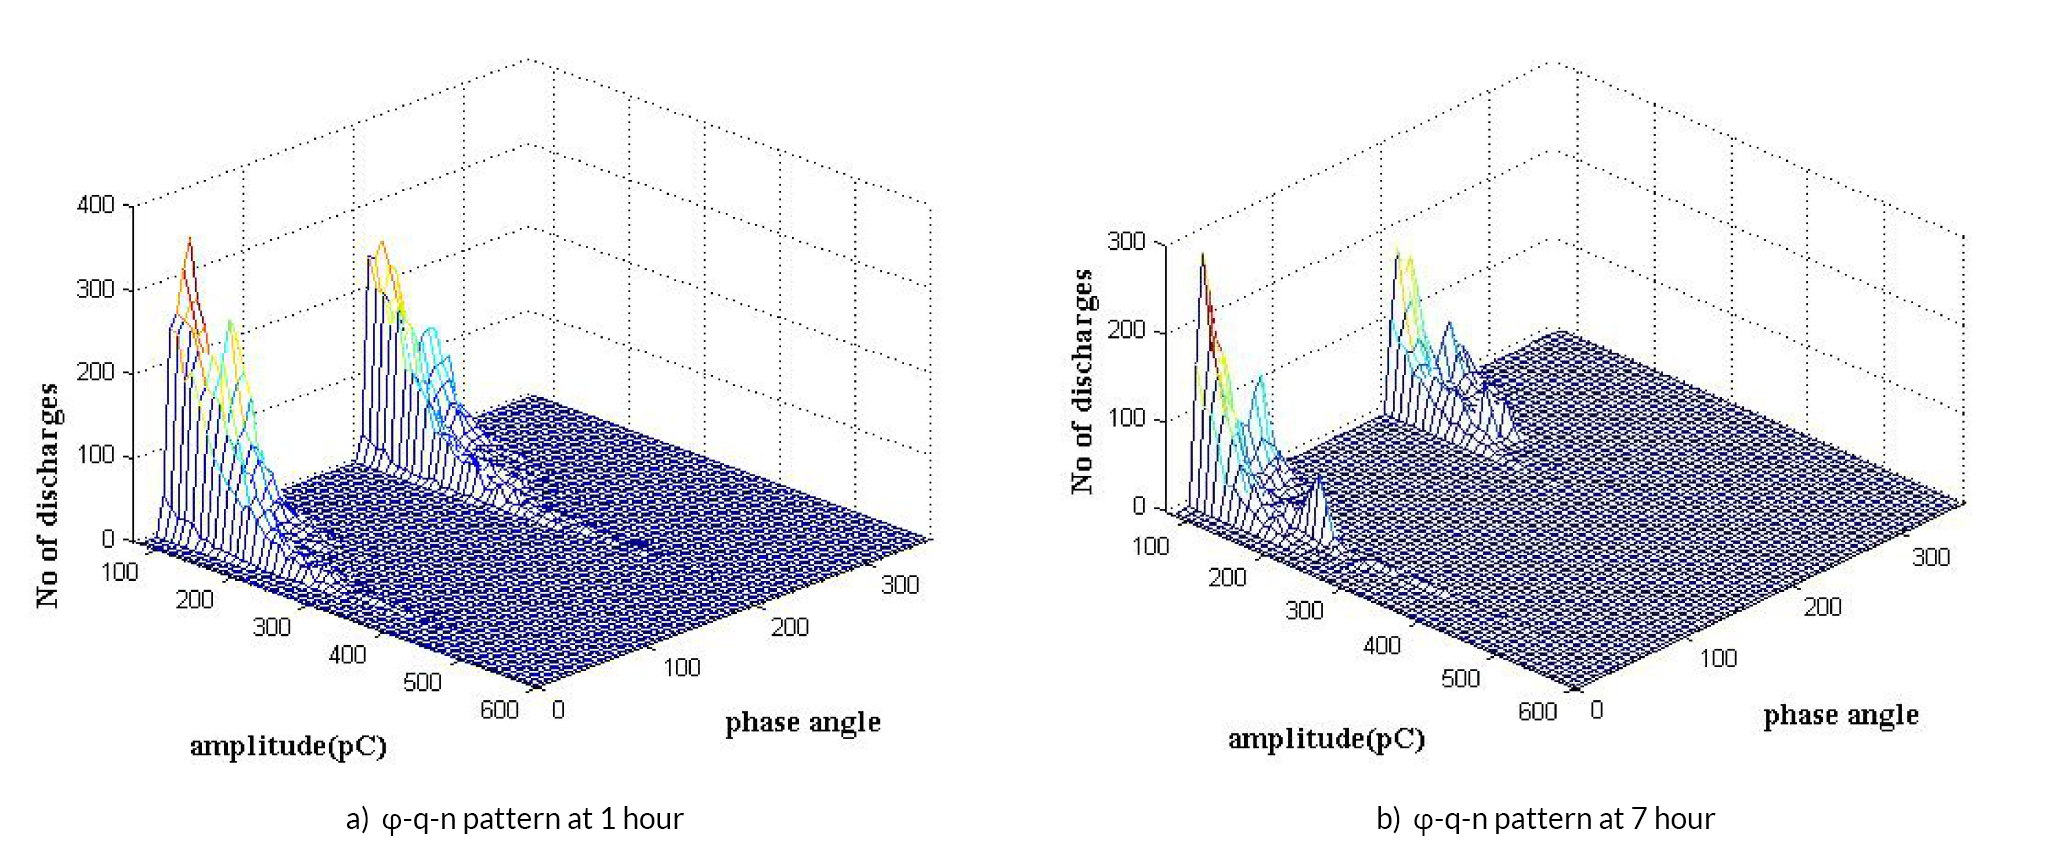
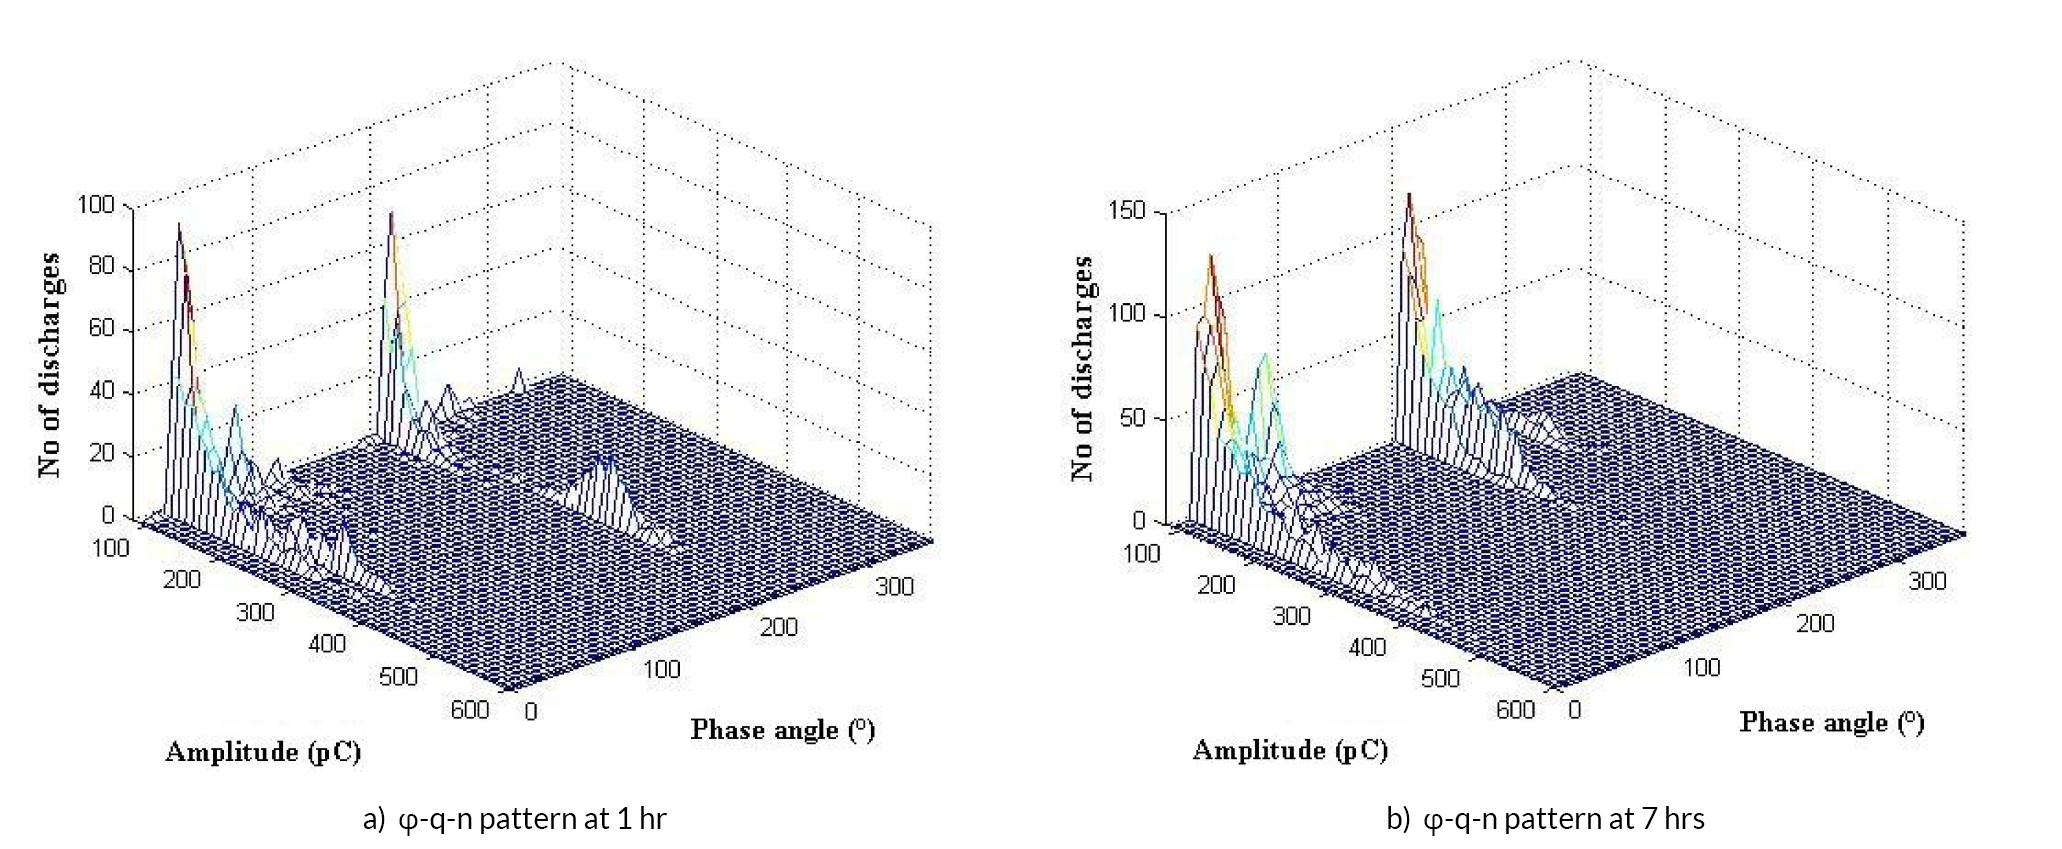
In this study, experiments were conducted to monitor the discharge patterns of electrode bounded cavity, single cavity (of different dimensions), parallel cavity and serial cavity in PET over a 7hr stressing time. i.e. when the insulation material begins to deteriorate. Figure 5 shows typical φ-q-n plots for 0.6mm cavity at 1hr and 7hr periods recorded over 250 and 50 cycles respectively. Figure 6 shows the φ-q-n distributions for a cavity with a diameter of 1mm.


Discharges in the 0.6mm and 1mm cavities can be seen to be centered around 150°~270° and 20° ~110° in the negative and positive half power cycles respectively. Furthermore, no significant peak amplitude variations within the 1-7 hr period, for both the 250 and 50 cycle captures in the 0.6mm diameter cavity (Figures 5a, 5b, 5c). When comparing the 7-hour φ-q-n capture to the 1-hour capture, an increasing number of PD events with higher amplitudes are observed for the 1mm diameter cavity (Figures 6a and 6c). The appearance of these discharges indicates that the cavity surface has begun to erode and degrade as a result of sustained PD activity and charge carriers becoming trapped within the cavity surface. As anticipated, the frequency of occurrence of PD pulses between 50 and 250 cycles has also increased. In the φ-q-n patterns of 1mm and 0.6mm diameter cavities, the PD rapidly changes from streamer-like to Townsend discharges at the cycle peak’s leading edge, which is why more discharges of increasing magnitude are observed when compared to the trailing edge.
The PD patterns for the parallel and serial cavity arrangements in PET are shown in Figures 7 and 8 for 1 hour and 7 hour periods. Jeon et al.25 demonstrated that PD characteristics (e.g., PDIV and PD inception field (PDIF)) are similar for single and parallel cavity configurations but change with serial cavity configurations. The PDIV and PDIF of a serial cavity are much higher than those of a parallel or single cavity. The frequency of occurrence of PD at higher amplitudes appears to be higher in a parallel cavity. Nevertheless, this solely depends on the distance or space between the two cavities. Due to electrostatic interaction, the closer the cavities, the more interaction among the fields in each cavity. On the other hand, if the cavities are widely spaced only a little or practically no electrostatic interaction can be noticed.26


Examples of the φ-q-n distributions for electrode bounded cavity are depicted in Figure 9. In contrast to the dielectric bounded cavity, the PD in the negative and positive cycles of the electrode bounded cavity are asymmetric, which is consistent with the literature.27 A 20-minute test was used in Gulski’s research, but the discharge patterns observed in this study go as far as the early stages of cavity deterioration. Gulski provided the following explanation for the asymmetry observed between the negative and positive half cycles28: A large number of initiating electrons are generated during the positive half cycle by the residual charge deposited on the cavity surface, whereas during the negative cycle, the electrons may be released from background radiation or even the surface of the electrode.

The implications of the results presented in this work are that for a solid HV insulation system, PD patterns can vary depending on the size, location, and period of degradation of the insulation. It is also important for power engineers to ascertain the extent of the fault and plan future maintenance actions to avoid the complete failure of the insulation.
4. Conclusions
In this study, PD experiments in single, serial, and parallel voids in PET were performed, and PD patterns in the form of φ-q-n were captured over two different cycles i.e. 50 and 250 cycles.
The φ-q-n patterns in PET for various cavity sizes and positions have been evaluated and compared. These PD patterns were captured over long test periods, implying that insulation degradation occurred while data was being recorded. The discharge patterns of single and serial cavities appear to be very similar, but they differ from those of parallel cavities. Although smaller discharges occurring at higher magnitudes are observed for 1mm diameter cavity in comparison to 0.6mm cavity, no discernible difference can be seen in the φ-q-n distributions. The similarity of the PD patterns for the two cavities of 1mm and 0.6mm diameter has also indicated that the generation and development of discharges in cavities are dependent on the thickness of the cavity rather than the diameter.
Future work concentrates on the application of artificial intelligence to automatically detect even small variations in the size of cavities as well as their positions within the HV insulation system.